Lab 2: Verifying Agent Output
Track 2: Agentic Analytics · Day 2 breakout lab
Your pipeline is built and the numbers look promising — hundreds of thousands of pounds in potential savings by shifting operations to low-carbon windows. But before those numbers go to an operations VP, you need to be sure they're right. This lab is about developing the habit and skill of verifying agentic output — not because AI is unreliable, but because knowing when and how to verify is one of the most valuable skills you can build right now.
AI won't often give you obviously wrong answers. It will give you reasonable answers that contain buried assumptions — a scheduling optimization that ignores shift boundaries, a cost saving calculation thar is based on assumed logic. Working within an agentic system that gives you visibility into the data and logic that produced the output, as well as the ability to edit the logic directly, allows you to catch these before sharing them with stakeholders.
Before you start
- Complete Lab 1: Agentic Analysis
- You should have a working carbon + operations pipeline in your workspace
- No SQL experience required, though reading Otto's queries will help
The plan
- Explore the optimization results — drill into the data behind the recommendations
- Verify the code — inspect the SQL transforms and check the optimization logic
- Verify the data — look at the underlying tables for surprises
- Build visualizations that tell the story for operations leadership
- Create a boardroom-ready executive summary
The verification framework
Before sharing any output with stakeholders, run it through these checks:
Check 1: Understand the output
- Do the savings feel realistic?
- Are certain machines or facilities dominating unexpectedly?
- Is anything surprising?
Ask yourself:
👉 Can I defend every number in this output?
Check 2: Inspect the code
- Are joins and transformations correct?
- Does the optimization respect the
schedulablecolumn? - Are shift boundaries (±8 hours) enforced?
- Is the predictive model using the correct data?
Check 3: Check the data underneath
- Any nulls or duplicates?
- Do timestamps align correctly?
- Does the operations data match expectations?
Running these three checks before you share anything adds maybe 5 minutes to your workflow. It's the difference between being the analyst who surfaces reliable insights and the one who occasionally sends leadership something embarrassing. That reputation compounds in both directions.
Step 1: Explore the data
Start asking questions to better understand how Otto arrived at its optimization results. Try something like:
Give me an overview of the pipeline you built. How did you go about building it? What assumptions did you make without asking me? Tell me about the scheduling optimization results. Which facilities have the biggest savings opportunity? Which machine types are being rescheduled the most?
Then drill into what interests you. Some directions worth exploring:
Which machines are currently scheduled during the highest carbon
intensity windows? Show me the top 10 worst offenders.
What are the projected cost savings by facility? Break down energy
cost savings vs carbon offset savings separately.
Are there any machines marked as schedulable that are being kept at
their current time because they're already in an optimal window?
How many are genuinely being moved?
Show me the carbon intensity forecast for the next 7 days. When are
the predicted low-carbon windows, and how confident is the model?
If you find something that doesn't look right — a machine that shouldn't be rescheduled, a savings number that seems too high — tell Otto in plain language what's wrong and ask it to investigate. This iterative correction is the core skill this lab is teaching.
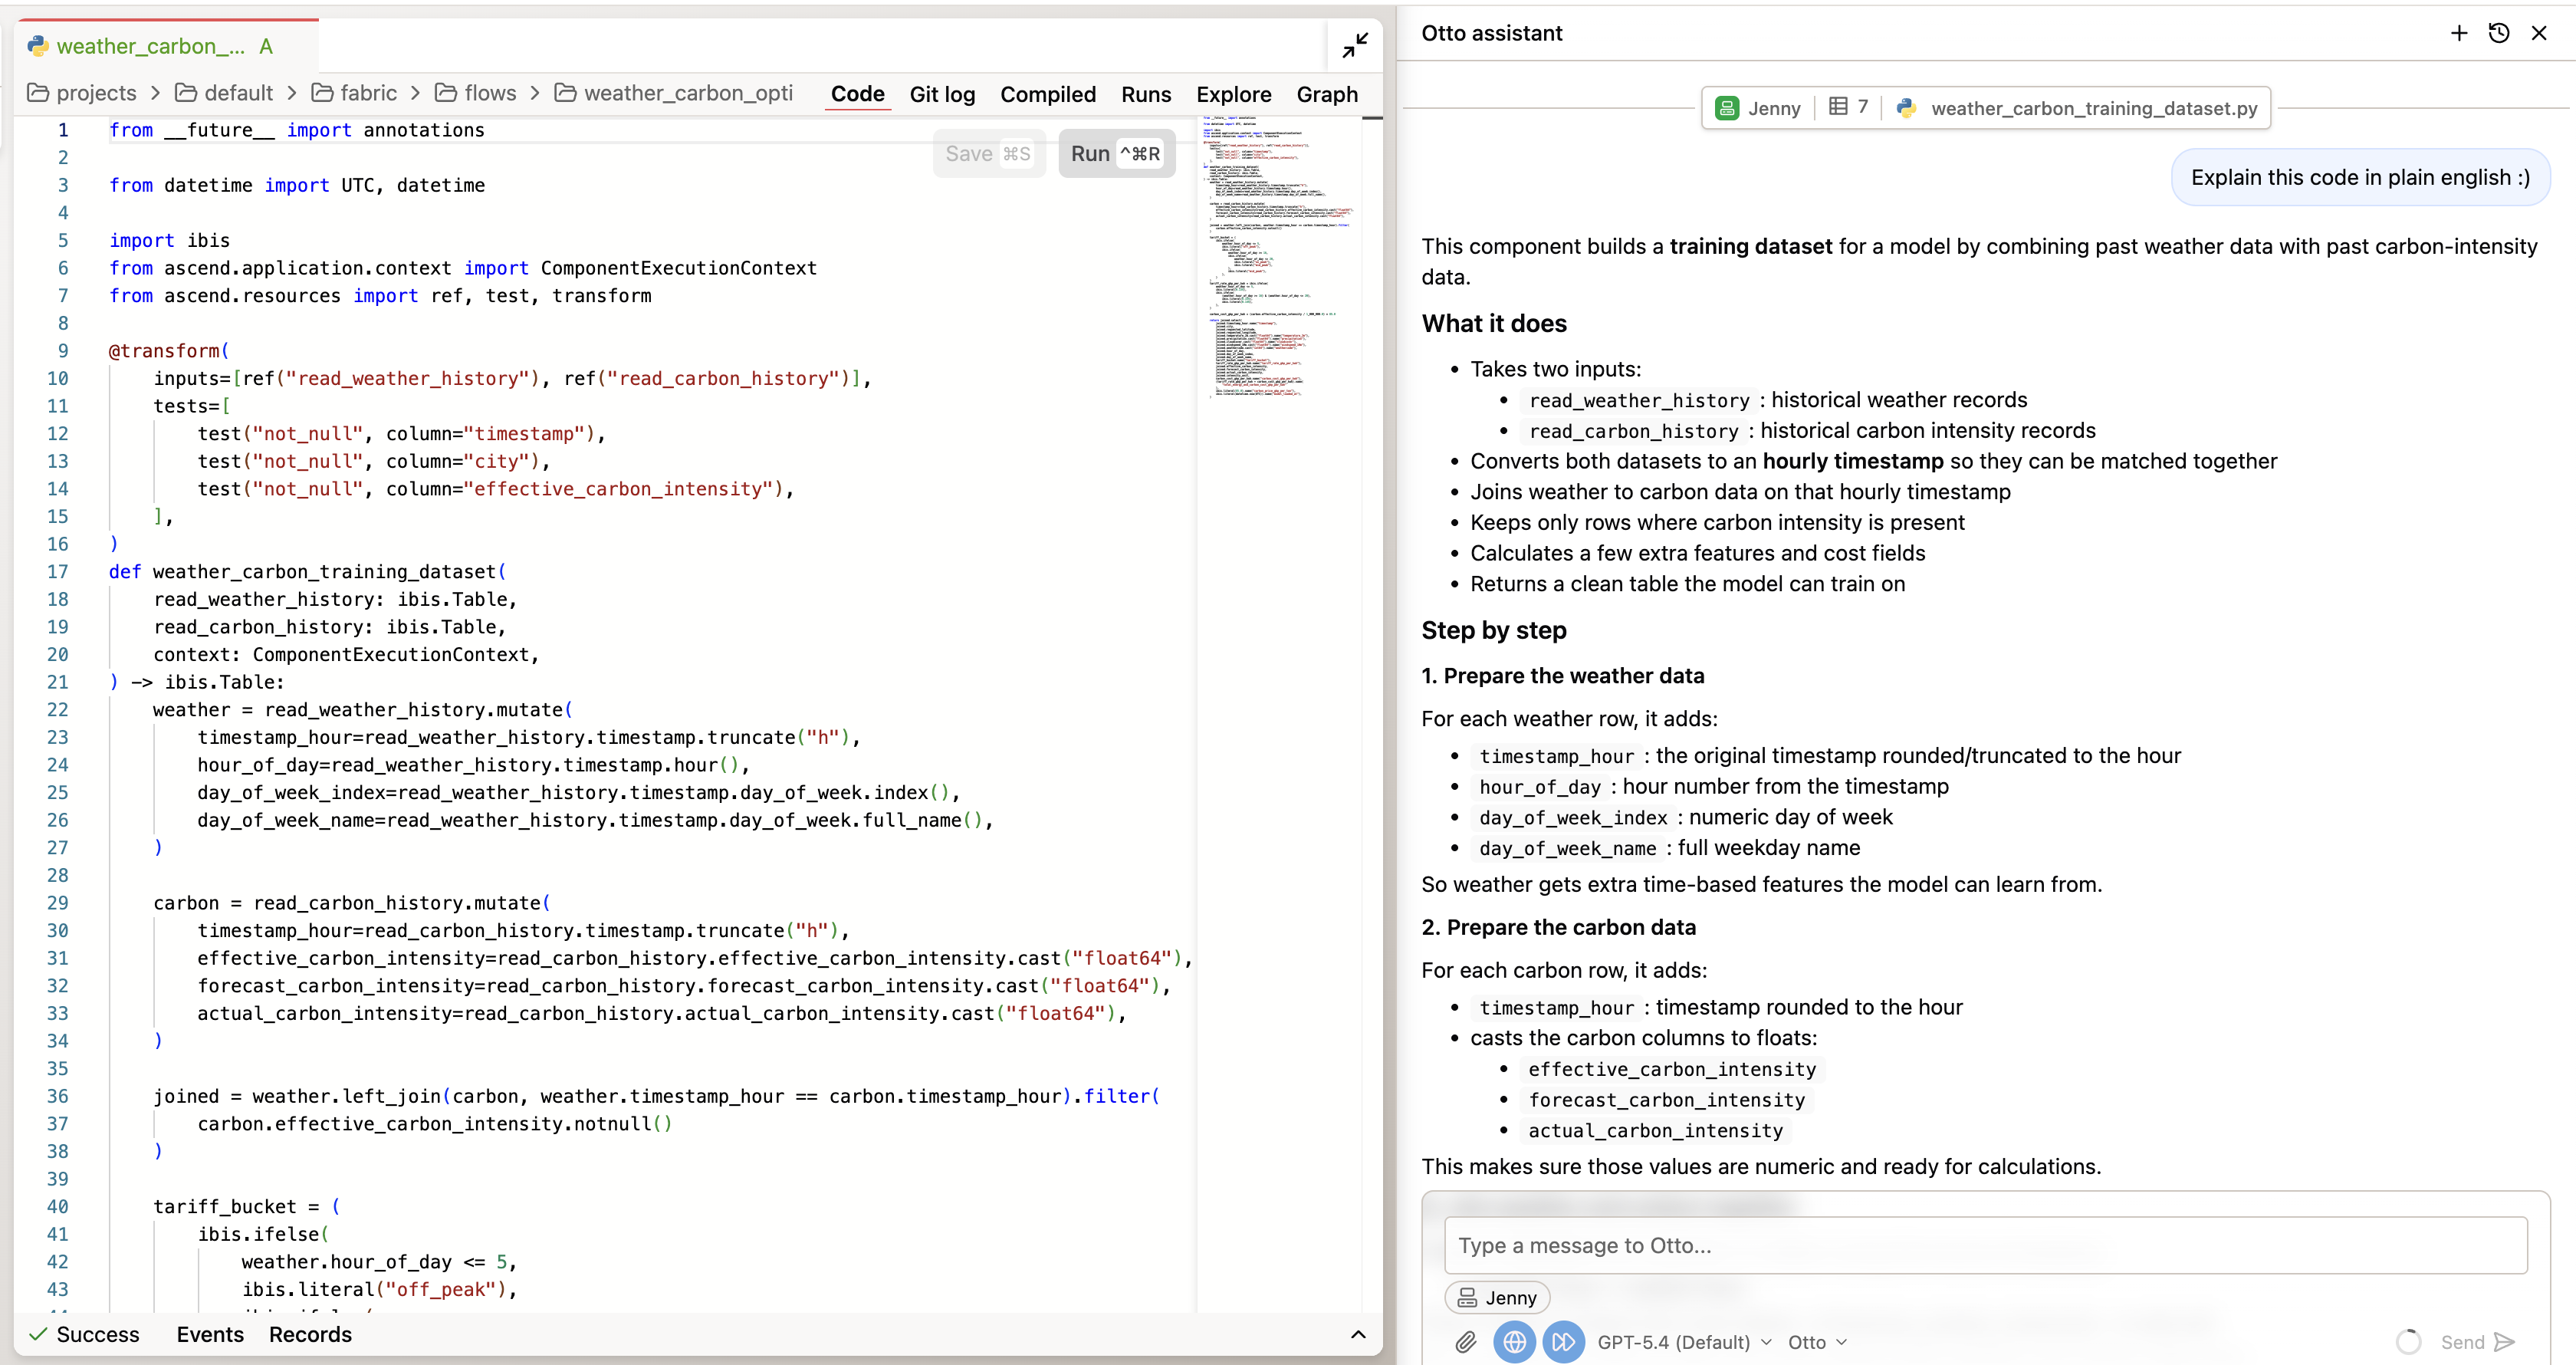
Step 2: Verify the code
Double-click into any of the components in the flow to inspect the code it wrote to produce the output. You can ask Otto to explain the code to you in plain english. Key things to check:
- Scheduling logic: Does the optimization respect
schedulable=trueonly? Are non-schedulable machines excluded from rescheduling? - Shift boundaries: Is the ±8 hour constraint enforced? Look for the actual logic that limits how far a machine can be moved.
- Cost calculations: How are energy cost savings calculated? What carbon price is being used for offset savings?
- Predictive model: What historical patterns drive the forecast? Is it using 30 days of carbon + weather data?
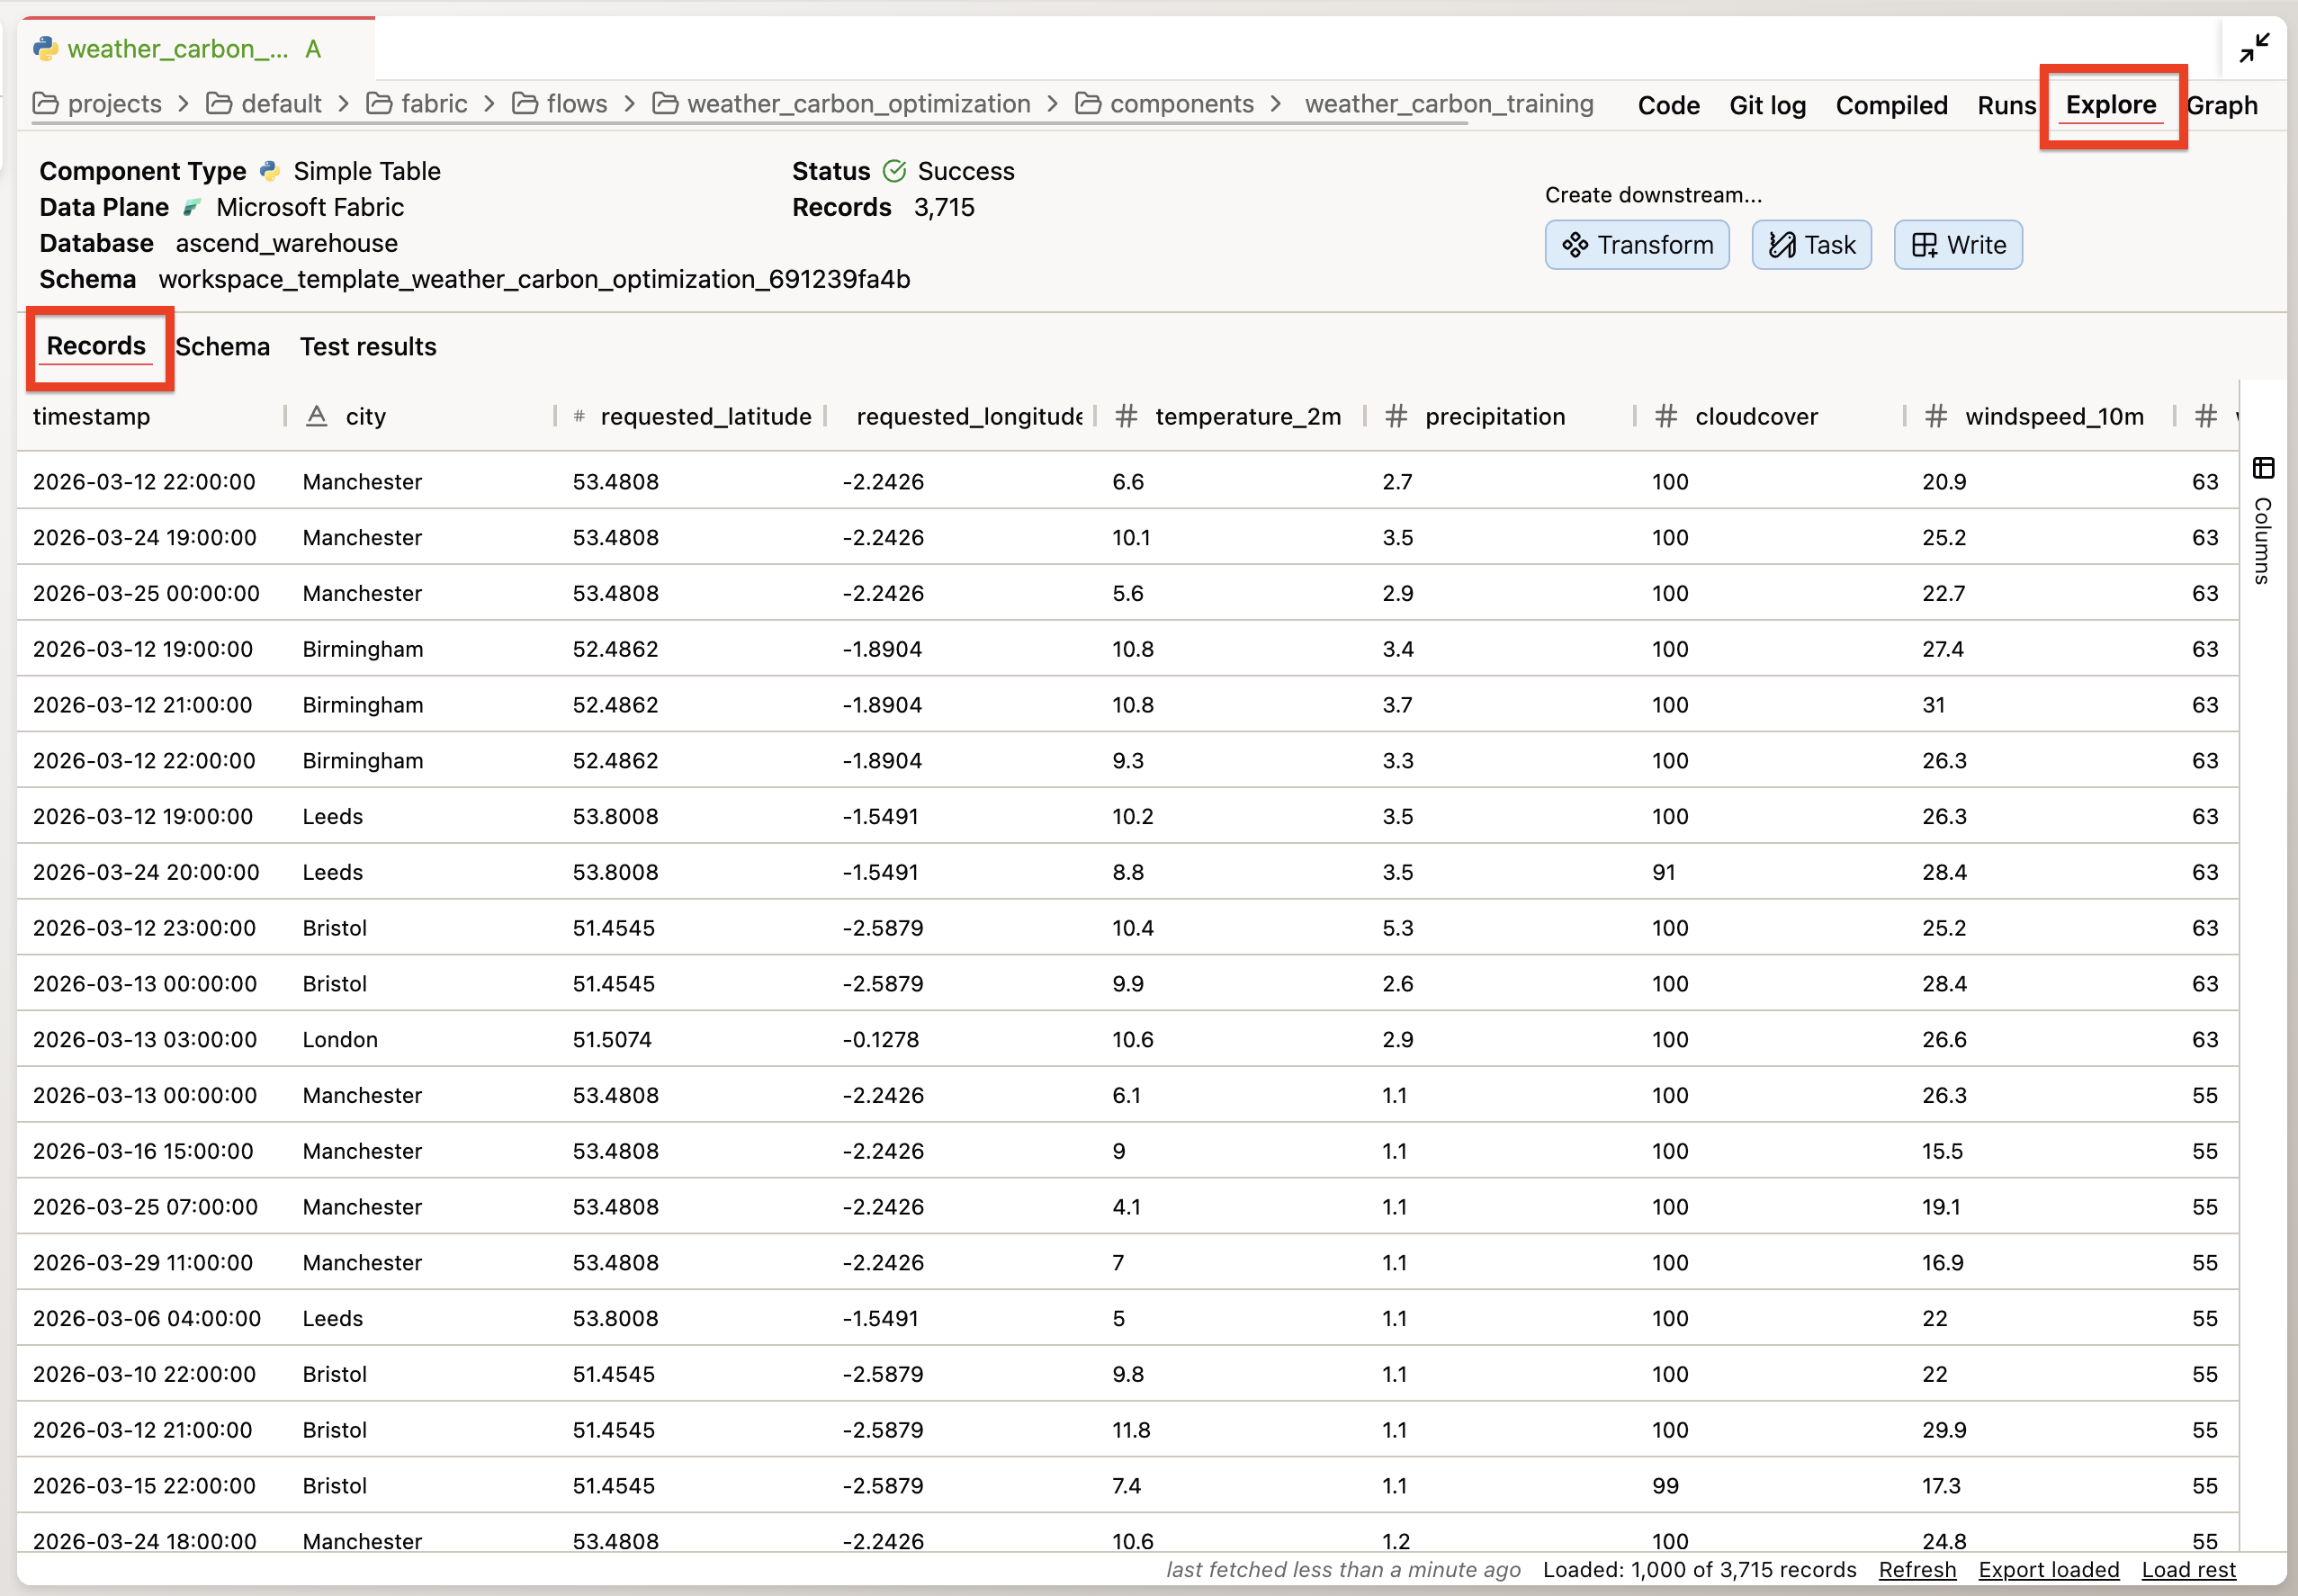
Step 3: Verify the data
Double-click into any of the components in the flow and go to the Explore tab to inspect the data. Key things to look for:
- Are all 5 facilities represented in the optimization output?
- Are there any null values in the cost savings columns?
- Does the production schedule data align with realistic shift patterns?
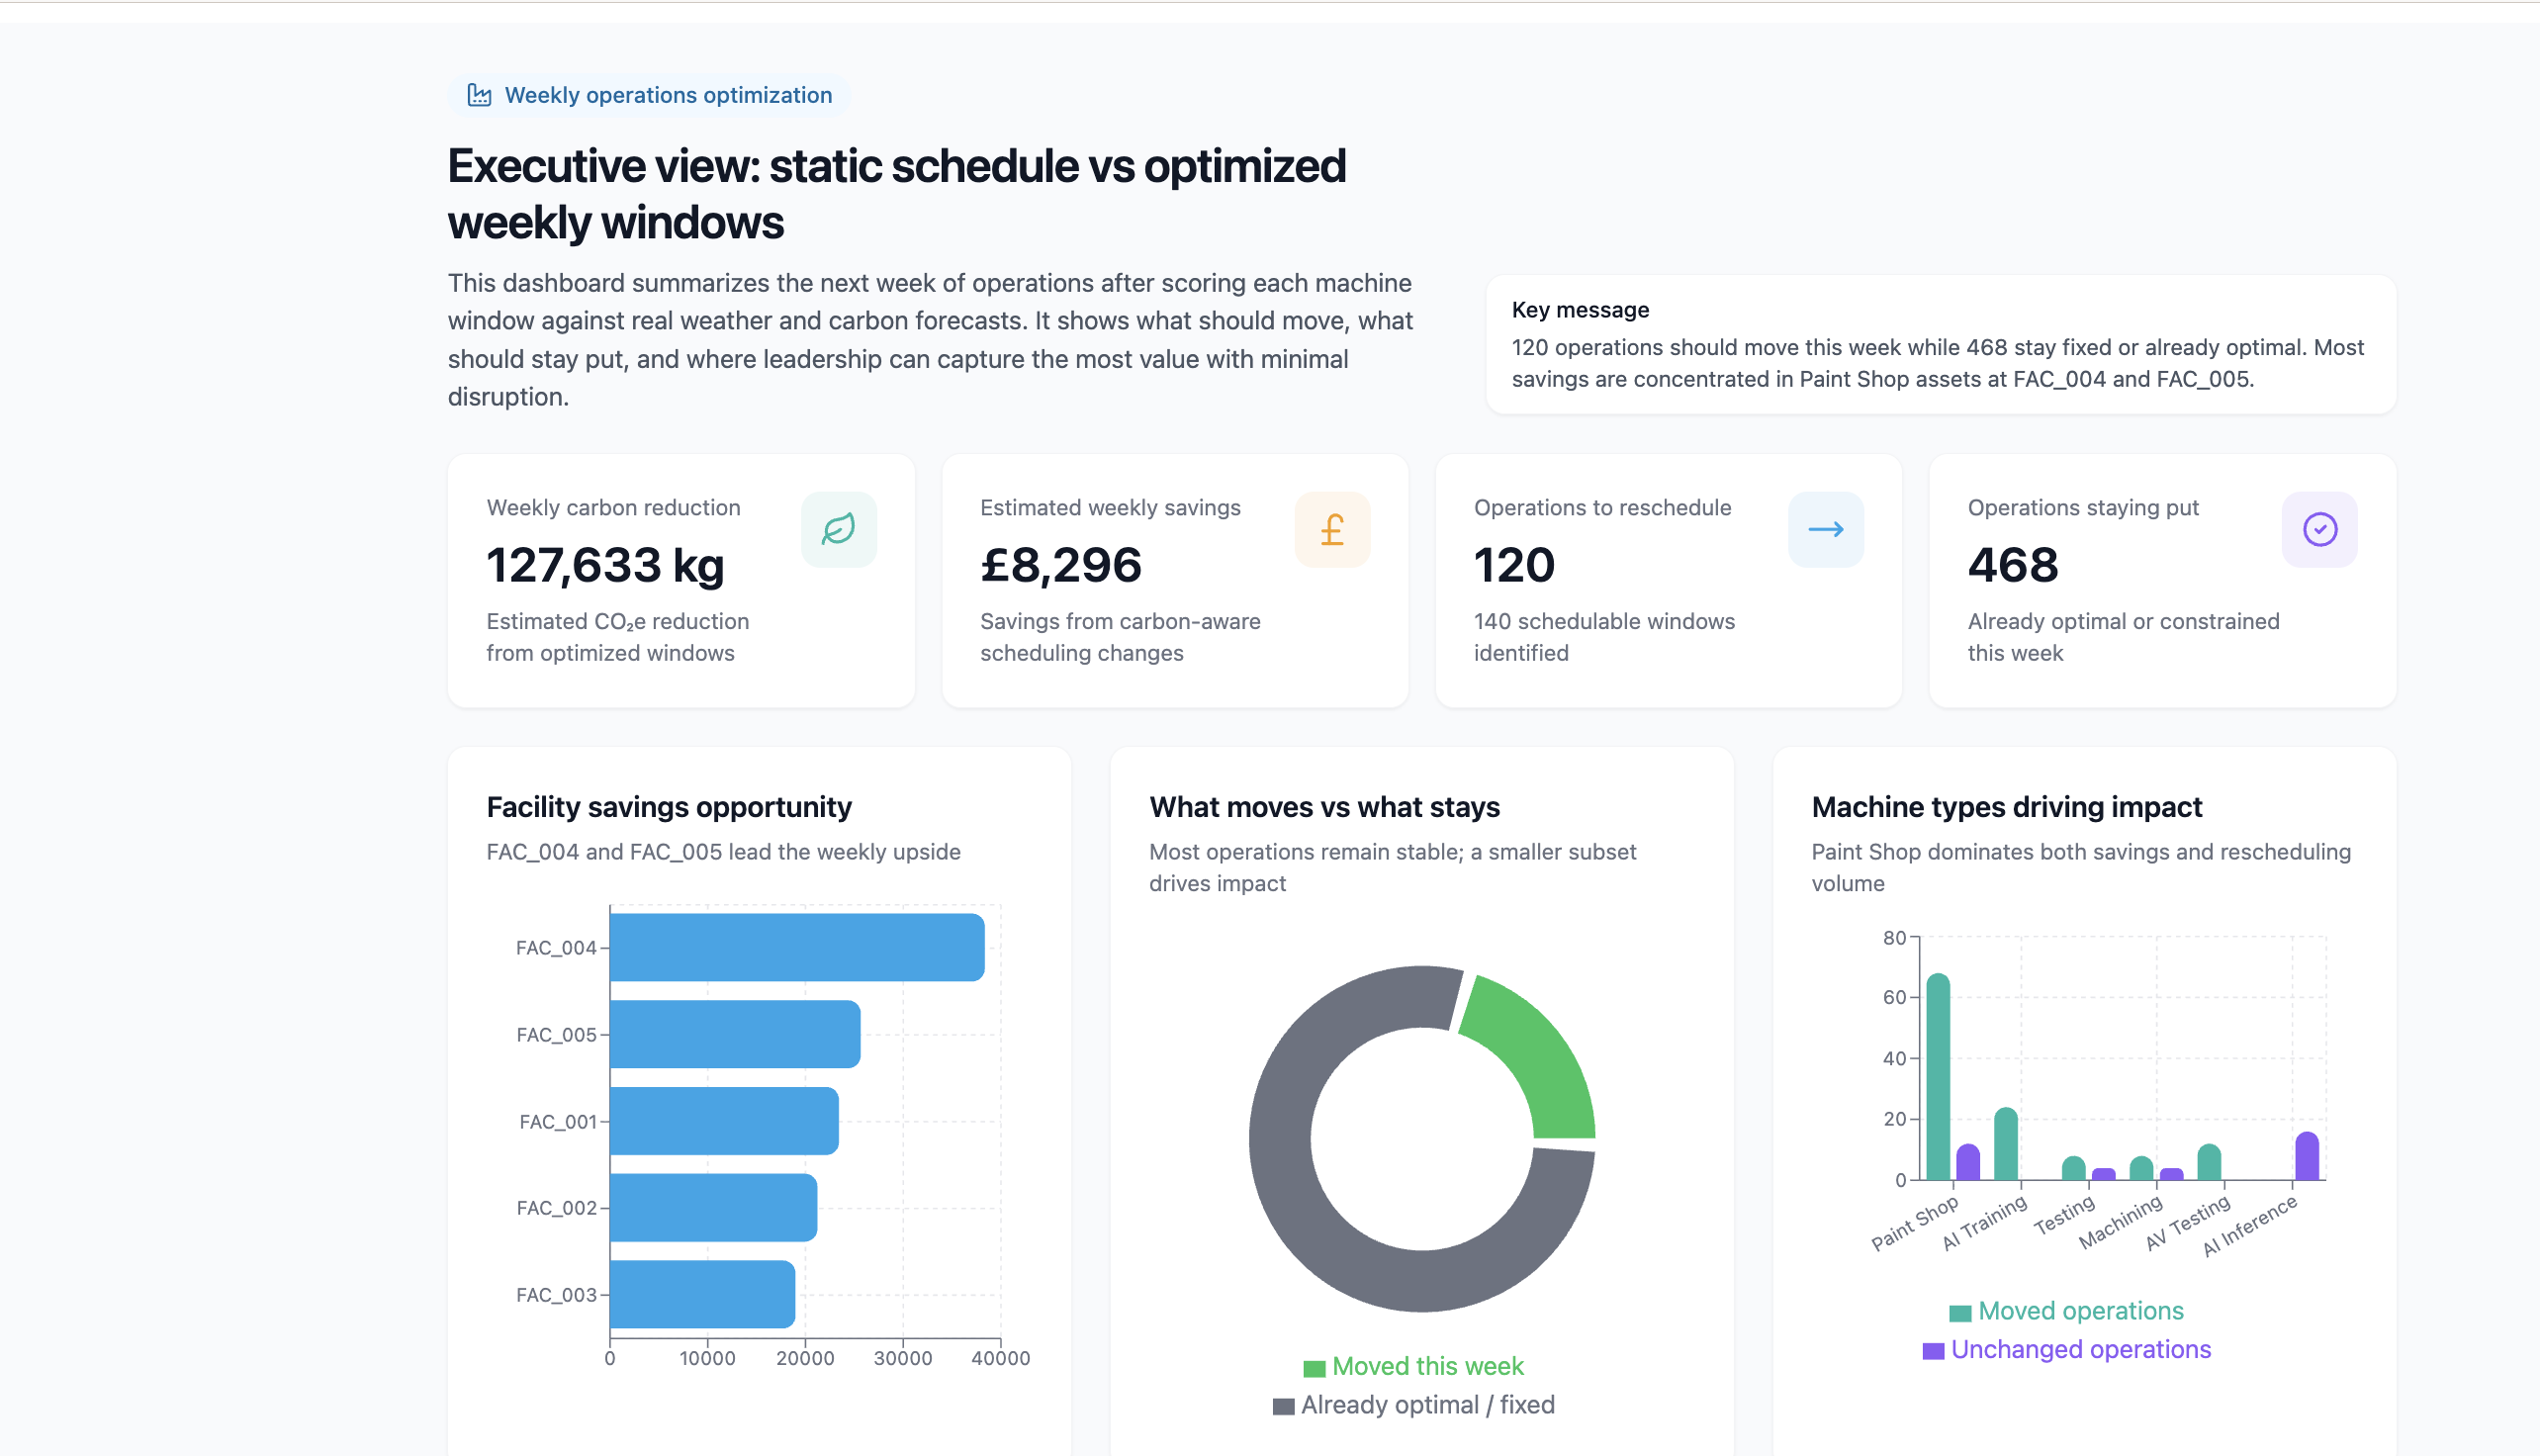
Step 4: Build visualizations
Now that you've verified the data, build visualizations that tell the story. The goal is a set of charts that an operations VP can understand in 5 minutes.
Create a visualization we can share with our operations leaders detailing the optimal operation windows for each machine and facility as well as clear cost savings for the next week of operations. Show both the operations we can reschedule and the ones that are already optimal or can't be moved. The result should be an executive summary of the impact of switching our scheduling from static weekly operations, to optimized windows each week.
Example of a completed visualization artifact summarizing optimal windows, reschedulable vs fixed operations, and savings:
Step 5: Create an executive summary
With your findings verified and visualized, create the deliverable you can share. Click the Save to project button in the artifact viewer to save the artifact to your project. From there you can edit the code that produced the artifact and share it with your stakeholders.
You've completed Lab 2!
By the end of this lab, you should have:
- Explored the optimization results and drilled into at least two specific findings
- Verified the scheduling logic respects constraints (schedulable flag, shift boundaries)
- Found and corrected at least one issue through iterative prompting
- Built visualizations showing current vs optimized schedules, savings by facility, and machine impact
- Created a boardroom-ready executive summary with concrete savings numbers
Need help? Ask a bootcamp instructor or reach out in the Ascend Community Slack.
Next steps
Continue to Lab 3: Repeatable Workflows to make this pipeline production-ready — fixing hardcoded dates, scheduling daily runs, and setting up alerts that tell you when carbon conditions change.
Resources
Questions?
Reach out to your bootcamp instructors or support@ascend.io.