Lab 1: Agentic Analysis
Track 2: Agentic Analytics · Day 2 breakout lab
In this lab you'll use Otto to build a comprehensive analysis from raw data sources. The business case: GreenTech Manufacturing is looking to tackle a critical sustainability challenge facing their five UK production facilities. The company consumes over 42 million kWh annually running energy-intensive operations, and with UK carbon offset costs at £85/ton CO2, their environmental impact is becoming a significant financial burden.
The key insight: the UK's electricity grid carbon intensity swings dramatically throughout the day. Your mission is to build an intelligent forecasting system that learns from 30 days of historical weather and carbon data to predict these low-carbon windows up to 7 days in advance, then identifies which flexible operations can be strategically shifted from high-carbon hours to clean-energy windows.
You're not writing code — Otto generates it for you. Your job is to ask good questions, inspect what Otto produces, and redirect when it's not quite right. Think of Otto as an analyst who works at the speed of thought — your job is to direct the work, not execute it.
Before you start
- Complete Hands-On Lab: Getting Agentic on Day 1
- You should have an Ascend account and an existing Project
- No SQL experience required — though it helps if you want to go deeper
The plan
- Build the full carbon + operations optimization pipeline with a single prompt
- Verify the pipeline runs successfully end-to-end
The dataset
You're working with five data sources that together tell the story of your manufacturing energy footprint:
| Source | What it provides |
|---|---|
| UK Carbon Intensity API | Real-time and historical carbon intensity of the UK electricity grid |
| Open-Meteo Weather API | Historical and forecast weather data for predictive modeling |
| Facilities (CSV) | 5 UK manufacturing sites with annual energy consumption and location |
| Machines (CSV) | 125 machines with energy draw, type, and whether they're can be scheduled |
| Production Schedule (CSV) | Weekly shift patterns showing when each machine runs |
Step 1: Build the data pipeline
A few terms you'll see in this lab:
- Flow — a data pipeline in Ascend. It's a connected set of steps that read, transform, and output data.
- Component — a single step in a flow. Components can be Python scripts that pull data from APIs, SQL queries that transform data, or file readers that load CSVs.
- Read component — a component that brings data into the flow from an external source (an API, a file, a database).
- Transform — a component that takes data from upstream components and reshapes or combines it, usually with SQL.
- SQL — structured query language, the standard way to query and transform tabular data. Otto writes SQL for you.
You're going to give Otto a single prompt, and it will build the entire optimization pipeline — combining our operations data with live weather and carbon intensity data to find the scheduling windows that save the most.
Make sure these settings are configured at the bottom of the Otto panel before sending your prompt:
- Attach a runtime — click + Runtime and select your Workspace. You should see your Workspace name appear once it's selected, indicating where Otto is working. This will also start your Workspace if it's been snoozing.
- Web browsing — click the globe icon so it's highlighted (blue). This lets Otto fetch live data from APIs.
- Auto-run queries — click the play icon (▶▶) so it's highlighted. This lets Otto run queries and flow runs without waiting for your manual approval each time.

Open Otto with Ctrl + I (or Cmd + I on Mac), start a new thread, and paste the following prompt:
Review the plan
Asking an agent to plan before building is one of the most effective patterns in agentic work. A plan forces the agent to reason through the full problem — data sources, dependencies, edge cases — before writing any code. It gives you a checkpoint to catch misunderstandings early (wrong API, missing constraint, bad assumption) when they're cheap to fix, instead of after 15 minutes of building the wrong thing. It also gives the agent a reference document it can check back against as it builds, reducing drift and hallucination on long-running tasks.
Otto will create a markdown plan file outlining the components it intends to build, the data sources, the modeling approach, and the pipeline architecture. Before Otto starts building, review the plan and look for:
- Does it reference the correct API endpoints and coordinates?
- Does it include the carbon price (£85/ton) and tariff values you specified?
- Does it plan to use the
schedulablecolumn to filter machines? - Does it include the iterative build-and-test approach?
Once you're satisfied, tell Otto to go ahead and build it.
If you'd rather skip the planning step, you can give Otto a pre-built plan directly. Copy the plan below into a file at plan/plan.md in your project's Files panel, then tell Otto: "Use the plan in plan/plan.md to build the flow. Build iteratively — test each component before moving to the next."
Click to expand the pre-built plan
Watch Otto work
Sit back and watch. Otto will:
- Create Python Read Components for weather and carbon intensity APIs
- Build a weather forecast component for the next 7 days
- Write SQL transforms to join all five data sources
- Build a predictive model for carbon intensity
- Calculate optimal scheduling windows for every machine
- Test each component individually, then run the full flow end to end
Otto isn't generating code in isolation — it's looking at the actual data coming back from the APIs and cross-referencing it with your operations data. If something fails, Otto reads the actual error message and fixes the issue based on what it observed.
This is a big project — Otto may take 50+ actions to build and debug the full pipeline. As a guardrail, Otto pauses after every 50 actions to ask for your approval before continuing. This prevents agents from running in continuous loops without supervision and spending unnecessary tokens. When you see the approval prompt, just confirm to let Otto keep going.
This is a complex pipeline with five data sources and a predictive model. Otto will likely hit errors and fix them over 5+ iterations. Each round, Otto reads the actual error logs and adjusts its approach. If Otto is still stuck after 15 minutes, try giving it a specific hint about the error you see in the flow run logs.
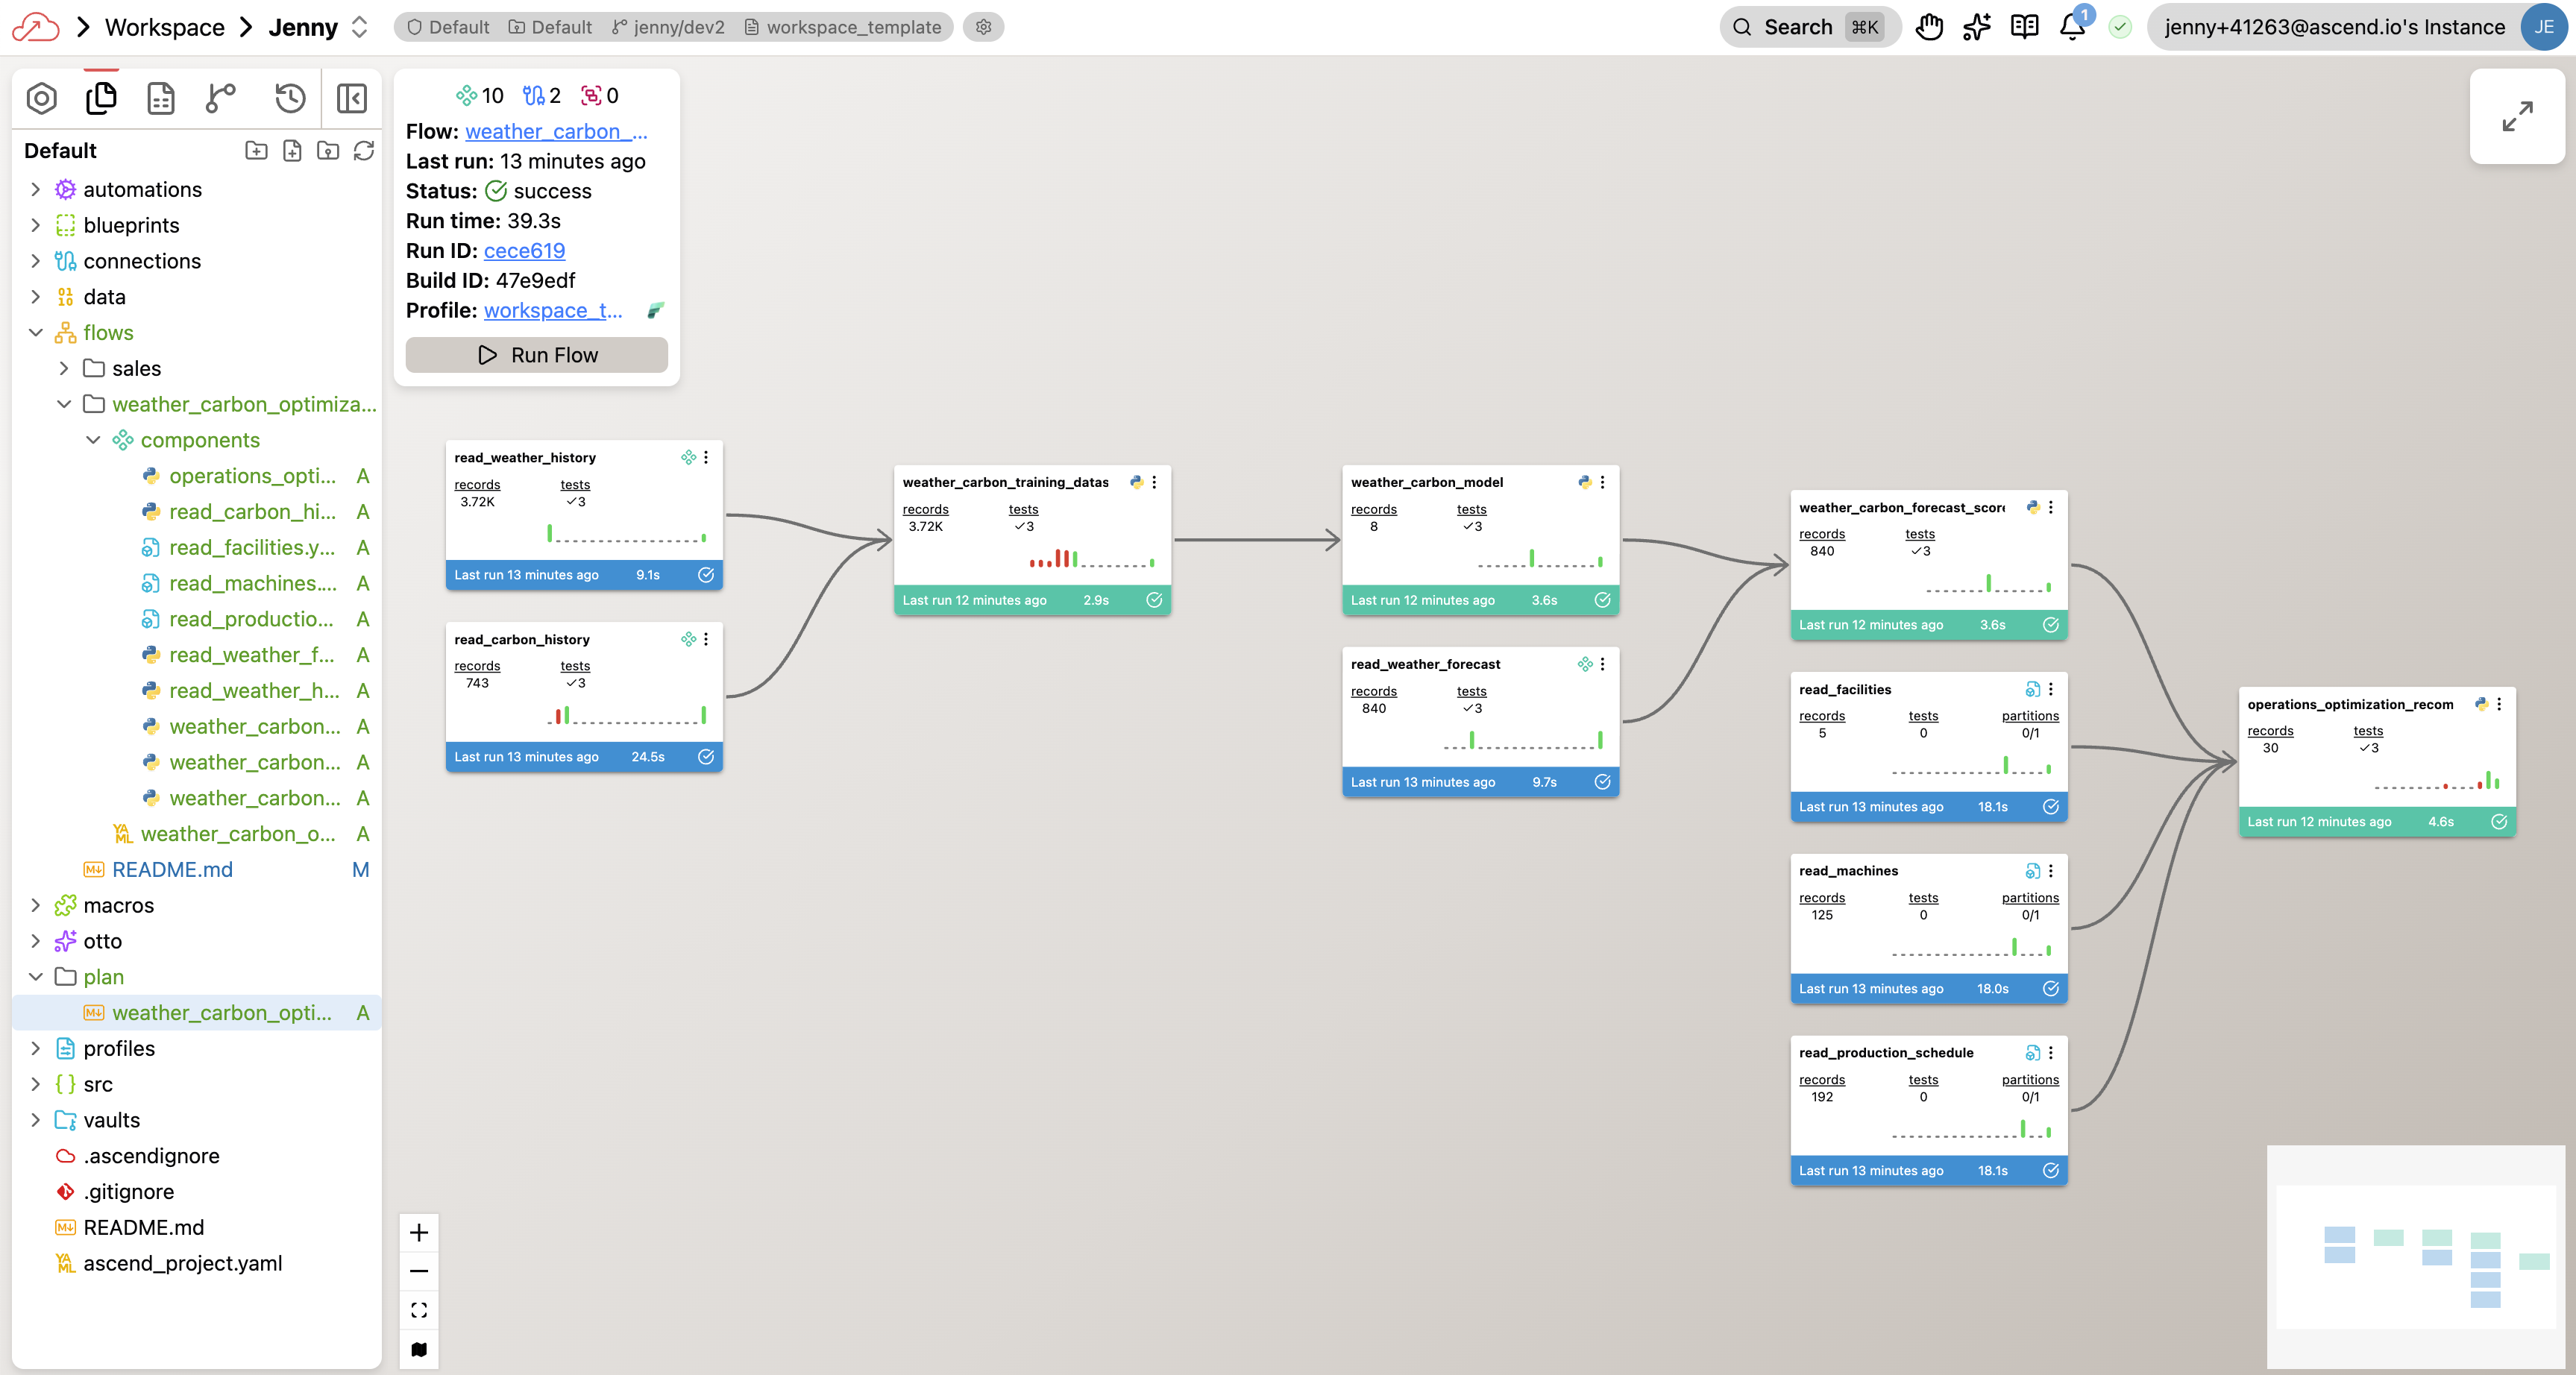
Your completed flow graph will look something like this — though your exact components and naming may differ depending on the approach Otto took:
Step 2: Verify the pipeline
Once the flow runs successfully, take a minute to spot-check the results before moving on to Lab 2. Your pipeline and results may be different from the other students in the bootcamp. This is to be expected. Otto will use the data in your project to build the pipeline and results, but has made some assumptions based on the data in your project that may lead to different outputs. To get an initial understanding of the results, you can ask Otto to give you a summary of the optimization results. The next lab will cover deeper insights into verifying agentic outputs.
Give me a quick summary of the optimization results. How many machines
can we reschedule? What are the projected savings?
You just did in 20 minutes what would typically take days — connecting to two live APIs, ingesting 30 days of historical data, building a predictive model, cross-referencing with your operations data, and producing scheduling recommendations with cost savings. Otto handled the Python, SQL, and API calls. You directed the analysis. That's the division of labor that scales.
You've completed Lab 1!
By the end of this lab, you should have:
- Built the carbon + operations optimization pipeline from a single prompt
- Verified the pipeline runs end-to-end
- Spot-checked the optimization results
Need help? Ask a bootcamp instructor or reach out in the Ascend Community Slack.
Next steps
Continue to Lab 2: Verifying Agent Output to explore the data, verify the optimization logic, and build visualizations you'd be confident presenting to an operations VP.
Questions?
Reach out to your bootcamp instructors or support@ascend.io.