Capstone Lab: Building an Agentic Data System
Five modules in. You built a monthly revenue-by-channel flow in the ADE 101 lab, added a schedule and a failure alert, and left it running in your workspace. Your manager wants it in Production by end of week. Four things have to be true before that happens — and this lab walks through all four, then creates the Deployment.
This is the capstone lab for ADE Systems Design (201). You need:
- Completed ADE Foundations (101) through the capstone lab — specifically:
- The
otto/rules/expeditions-code-standards.mdrule (always-on) - A working monthly revenue-by-channel flow (channel, transaction count, distinct customer count, average transaction value, total revenue — one row per channel per month)
automations/— a daily 6 AM UTC schedule YAML and aFlowRunFailure → email_alertYAML
- The
- Completed ADE 201 Modules 1–6 — this lab applies all six
Each step is self-contained. You can work in spurts.
About the tools: This lab runs in Ascend. If you're on a different stack, the patterns in each step transfer — the specific prompts target Otto.
Learning objectives
By the end of this lab, you will be able to:
- Assess a project against the four infrastructure readiness dimensions before promoting to production
- Configure a multi-layer context stack using glob-scoped rules, keyword-scoped rules, a learning command, and a custom agent
- Verify agent-generated output using the three-check framework before it reaches stakeholders
- Document a trust level assignment with measurable promotion criteria and a tool permissions audit
- Explain why agentic automations require a Deployment — and create one to make the 101 lab's automations production-ready
Step 1: Assess the architecture (~15 min)
Before any pipeline ships, the infrastructure around it has to be ready for the agent to operate reliably. The Architecture module defined four dimensions: Context, Tools, Triggers, and Guardrails. This step applies them to the Expeditions project.
Ask Otto to score the project against all four dimensions at once. The point is to get a grounded assessment — not a generic checklist — based on what actually exists in your project.
Open Otto in Ascend, or your favorite AI assistant of choice, and paste:
Otto will produce four assessments and write plan/architecture.md. After Otto produces the assessment, compare its architecture recommendation to your project constraints. For the Expeditions scope — well-bounded task, sequential workflow, single team, fits comfortably in one context window — single-agent is typically the right conclusion. Evaluate whether Otto's reasoning is grounded in the actual project or falls back on generic boilerplate.
What to check in plan/architecture.md:
- Does it name specific things from the Expeditions project — not boilerplate language copied from a template?
- Does the architecture decision state a reason for the pattern choice, not just name the pattern?
- Is "success" defined in terms of what the flow should produce and when?
If the document reads like a generic architecture template rather than a decision grounded in this project, ask Otto to revise: "Rewrite the architecture decision to be specific to the Expeditions project — what does this pipeline actually do, and why does single-agent fit this particular scope?"
Otto has access to your project's flow graph, run history, and component metadata through its runtime connection. When you ask for a readiness assessment, it reads your actual schema and lineage rather than inferring from prompt descriptions. The four-dimension framework applies to any agentic system — the specifics change, but the questions (context available? tools scoped? triggers in place? guardrails — permissions bounded and audit trail?) transfer to any stack.
Step 2: Deepen the context stack (~20 min)
The ADE 101 lab created one always-on rule — otto/rules/expeditions-code-standards.md. That's a foundation. A production system needs a full context stack: scoped rules that fire only when relevant, a command for continuous learning, and a custom agent for failure investigation.
Here's the target directory structure when this step is complete:
otto/
├── agents/
│   └── failure-investigator.md     ← custom agent (Part D)
├── commands/
│   └── learning.md                 ← custom command (Part C)
└── rules/
    ├── expeditions-code-standards.md   ← always-on (from ADE 101)
    ├── sql_standards.md                ← glob-scoped: *.sql (Part A)
    └── revenue_definitions.md          ← keyword-scoped: "revenue" (Part B)
Run four prompts in sequence. Each creates one file.
Part A: SQL standards rule (glob-scoped)
Create a glob-scoped rule at otto/rules/sql_standards.md that applies to all SQL
files (*.sql). If otto/rules/expeditions-code-standards.md exists, extend it with
SQL-specific guidance. Otherwise, infer conventions from the existing SQL in this
project and note that the rule was inferred from project code. Include guidance on:
how to handle nulls, how to name intermediate CTEs, when to use UNION vs JOIN.
What to look for: Open otto/rules/sql_standards.md in the Files panel. The YAML frontmatter should have alwaysApply: false and a globs field:
---
otto:
  rule:
    alwaysApply: false
    description: SQL-specific code standards for Expeditions transforms
    globs:
      - "*.sql"
---
This rule fires when Otto is working with SQL files — not when you're discussing architecture or reviewing YAML. It keeps detailed SQL guidance out of conversations where it's irrelevant.
Part B: Revenue definitions rule (keyword-scoped)
Locate the final output component for the monthly revenue-by-channel flow. Inspect
its schema, lineage, and a sample of its output. Then create a keyword-scoped rule
at otto/rules/revenue_definitions.md scoped to the keyword "revenue". Document:
which channels are included, how revenue is calculated, how returns or refunds are
handled if they appear in the data, and the dataset grain (one row per what?).

If you cannot locate the output component, report what is missing instead of
inferring definitions.
What to look for: The frontmatter should use keywords rather than globs:
---
otto:
  rule:
    alwaysApply: false
    description: Revenue calculation definitions for the Expeditions dataset
    keywords:
      - revenue
---
Unlike glob-scoped rules (which match file patterns), keyword-scoped rules match words in your prompt. Mention "revenue" and this rule loads automatically. Work on something else and it stays out of the context window.
As the rules library grows, scoping matters. Without glob and keyword scoping, every rule would load into every conversation — consuming context that belongs to the actual task. Scoping gives Otto deep domain knowledge across many areas without the noise. The ADE 101 always-on rule was appropriate for universal standards; these two rules carry guidance that only matters in specific situations.
Part C: Learning command
Rules and commands serve different purposes. Rules load automatically — always-on rules load into every conversation, glob-scoped rules load when Otto is working with matching files, and keyword-scoped rules load when specific words appear in your prompt. They shape Otto's behavior passively. Commands are pre-canned prompts you invoke by name — if you find yourself running the same kind of task repeatedly, turning it into a command saves you from re-prompting each time and locks in your best, most refined version of that prompt. The learning command is a good example: you don't want Otto reflecting on every conversation automatically, only when you explicitly ask it to.
Create a custom command at otto/commands/learning.md. When invoked with
"run @command/learning.md", this command should prompt you to review the current
conversation for new patterns, corrections, or lessons — then propose adding or
updating rule files. Keep proposals concise and wait for confirmation before
writing anything.
Part D: Failure investigator agent
Custom agents let you write your own instructions that extend Otto's defaults — adding role constraints, output format requirements, and non-negotiables on top of the base agent behavior. When you use extends: chat in the frontmatter, Otto's default capabilities (tool access, schema awareness) are inherited; your instructions layer on top. The Failure Investigator's non-negotiables ensure it stays in the investigator role — it surfaces and proposes, but doesn't act. That boundary exists because a fixer acting autonomously in a failure scenario is exactly when the most damage can happen.
After creating all four files, open the Files panel and confirm the otto/ directory matches the structure above. If any file is missing or misplaced, ask Otto to create or move it before continuing.
Step 3: Verify the output (~20 min)
A pipeline that runs is not the same as a pipeline that's correct. The verification step closes that gap — before the flow ships, not after.
The revenue-by-channel flow produced numbers in ADE 101. Before those numbers go to production — and before your manager sees them — you need to verify they're right. The three-check framework from the Trust and Verify module structures that verification.
Run three prompts in sequence. Don't skip ahead — each check builds on the previous one.
Check 1: Understand the output
Find the final output component for the monthly revenue-by-channel flow. Before
showing any code, explain what it produces: which channels exist, what counts as
a transaction, what date range the output covers, and what the grain is (one row
per what?). Support the explanation with schema, lineage, and output queries.

If you cannot identify the output component, report that first.
This check is deliberately prose-first. You want Otto to commit to a plain-language explanation of what the flow produces — grounded in actual schema, lineage, and output — before either of you looks at code. If the explanation is vague ("it aggregates transactions by channel" without specifics, or Otto can't locate the output component), that's the signal the context stack needs more definition in otto/rules/revenue_definitions.md.
After this check, note: Which channels exist? What date range? What's the grain of the output (one row per channel per month)? Write this down — you'll reference it in Check 3.
Check 2: Inspect the implementation
Show me the implementation for the total revenue calculation in the monthly
revenue-by-channel flow. Walk through the filters applied — which rows are
included and which are excluded, and why. Compare it against
otto/rules/expeditions-code-standards.md if that file exists. If it doesn't,
compare against the project's observed coding conventions and say so explicitly.
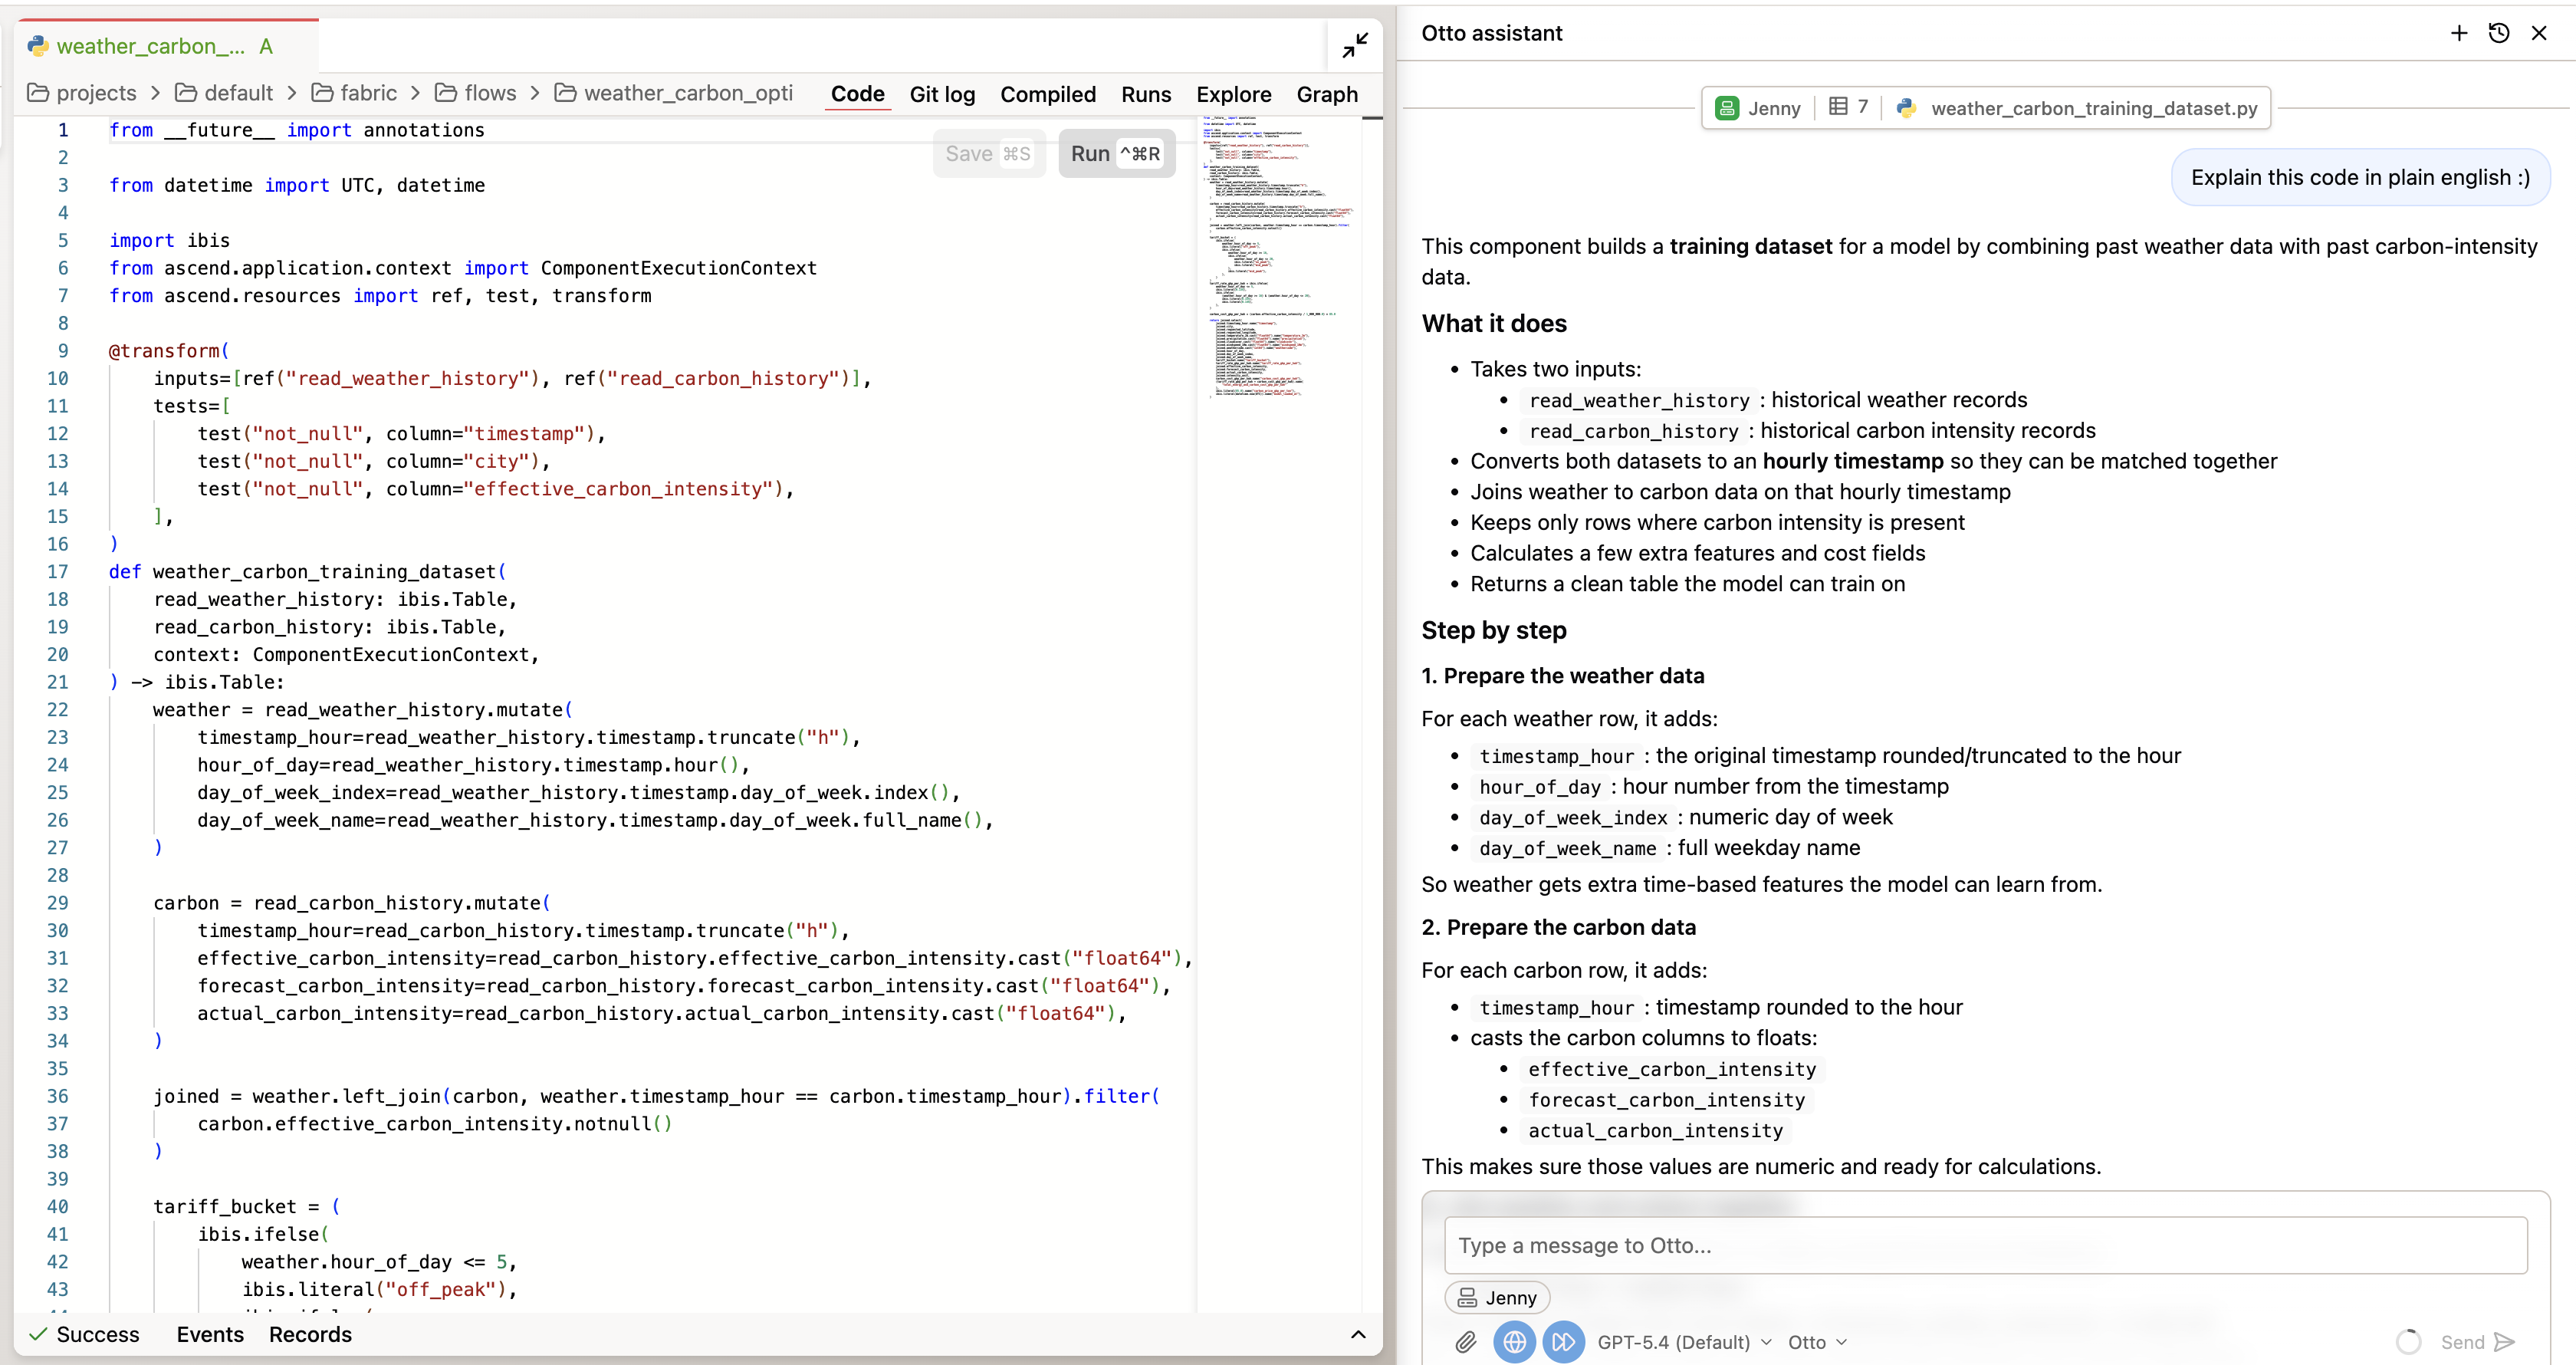
To inspect the code directly, double-click any component in the flow graph to open it, then switch to the Code tab to see the SQL Otto wrote.
You're looking for:
- Is the revenue calculation consistent with the definition in
otto/rules/revenue_definitions.md? - Are filters applied correctly — correct date ranges, correct channel scoping?
- Does the SQL follow the null handling, CTE naming, and join conventions from the standards files?
If Otto identifies a deviation from the code standards, note it. That's valuable — it means the context stack is doing its job. If the implementation fully matches the standards, note that too. Either finding is your verification record.
Check 3: Query the data
Query the final output component for the monthly revenue-by-channel flow. Show me:
(1) the distinct channels and row count per channel per month,
(2) any months where transaction_count is zero for any channel,
(3) total revenue across all channels.

Flag any anomalies: duplicate rows at the expected grain, null channels, negative
revenue, or missing months. If you cannot identify the output component, report
that instead.
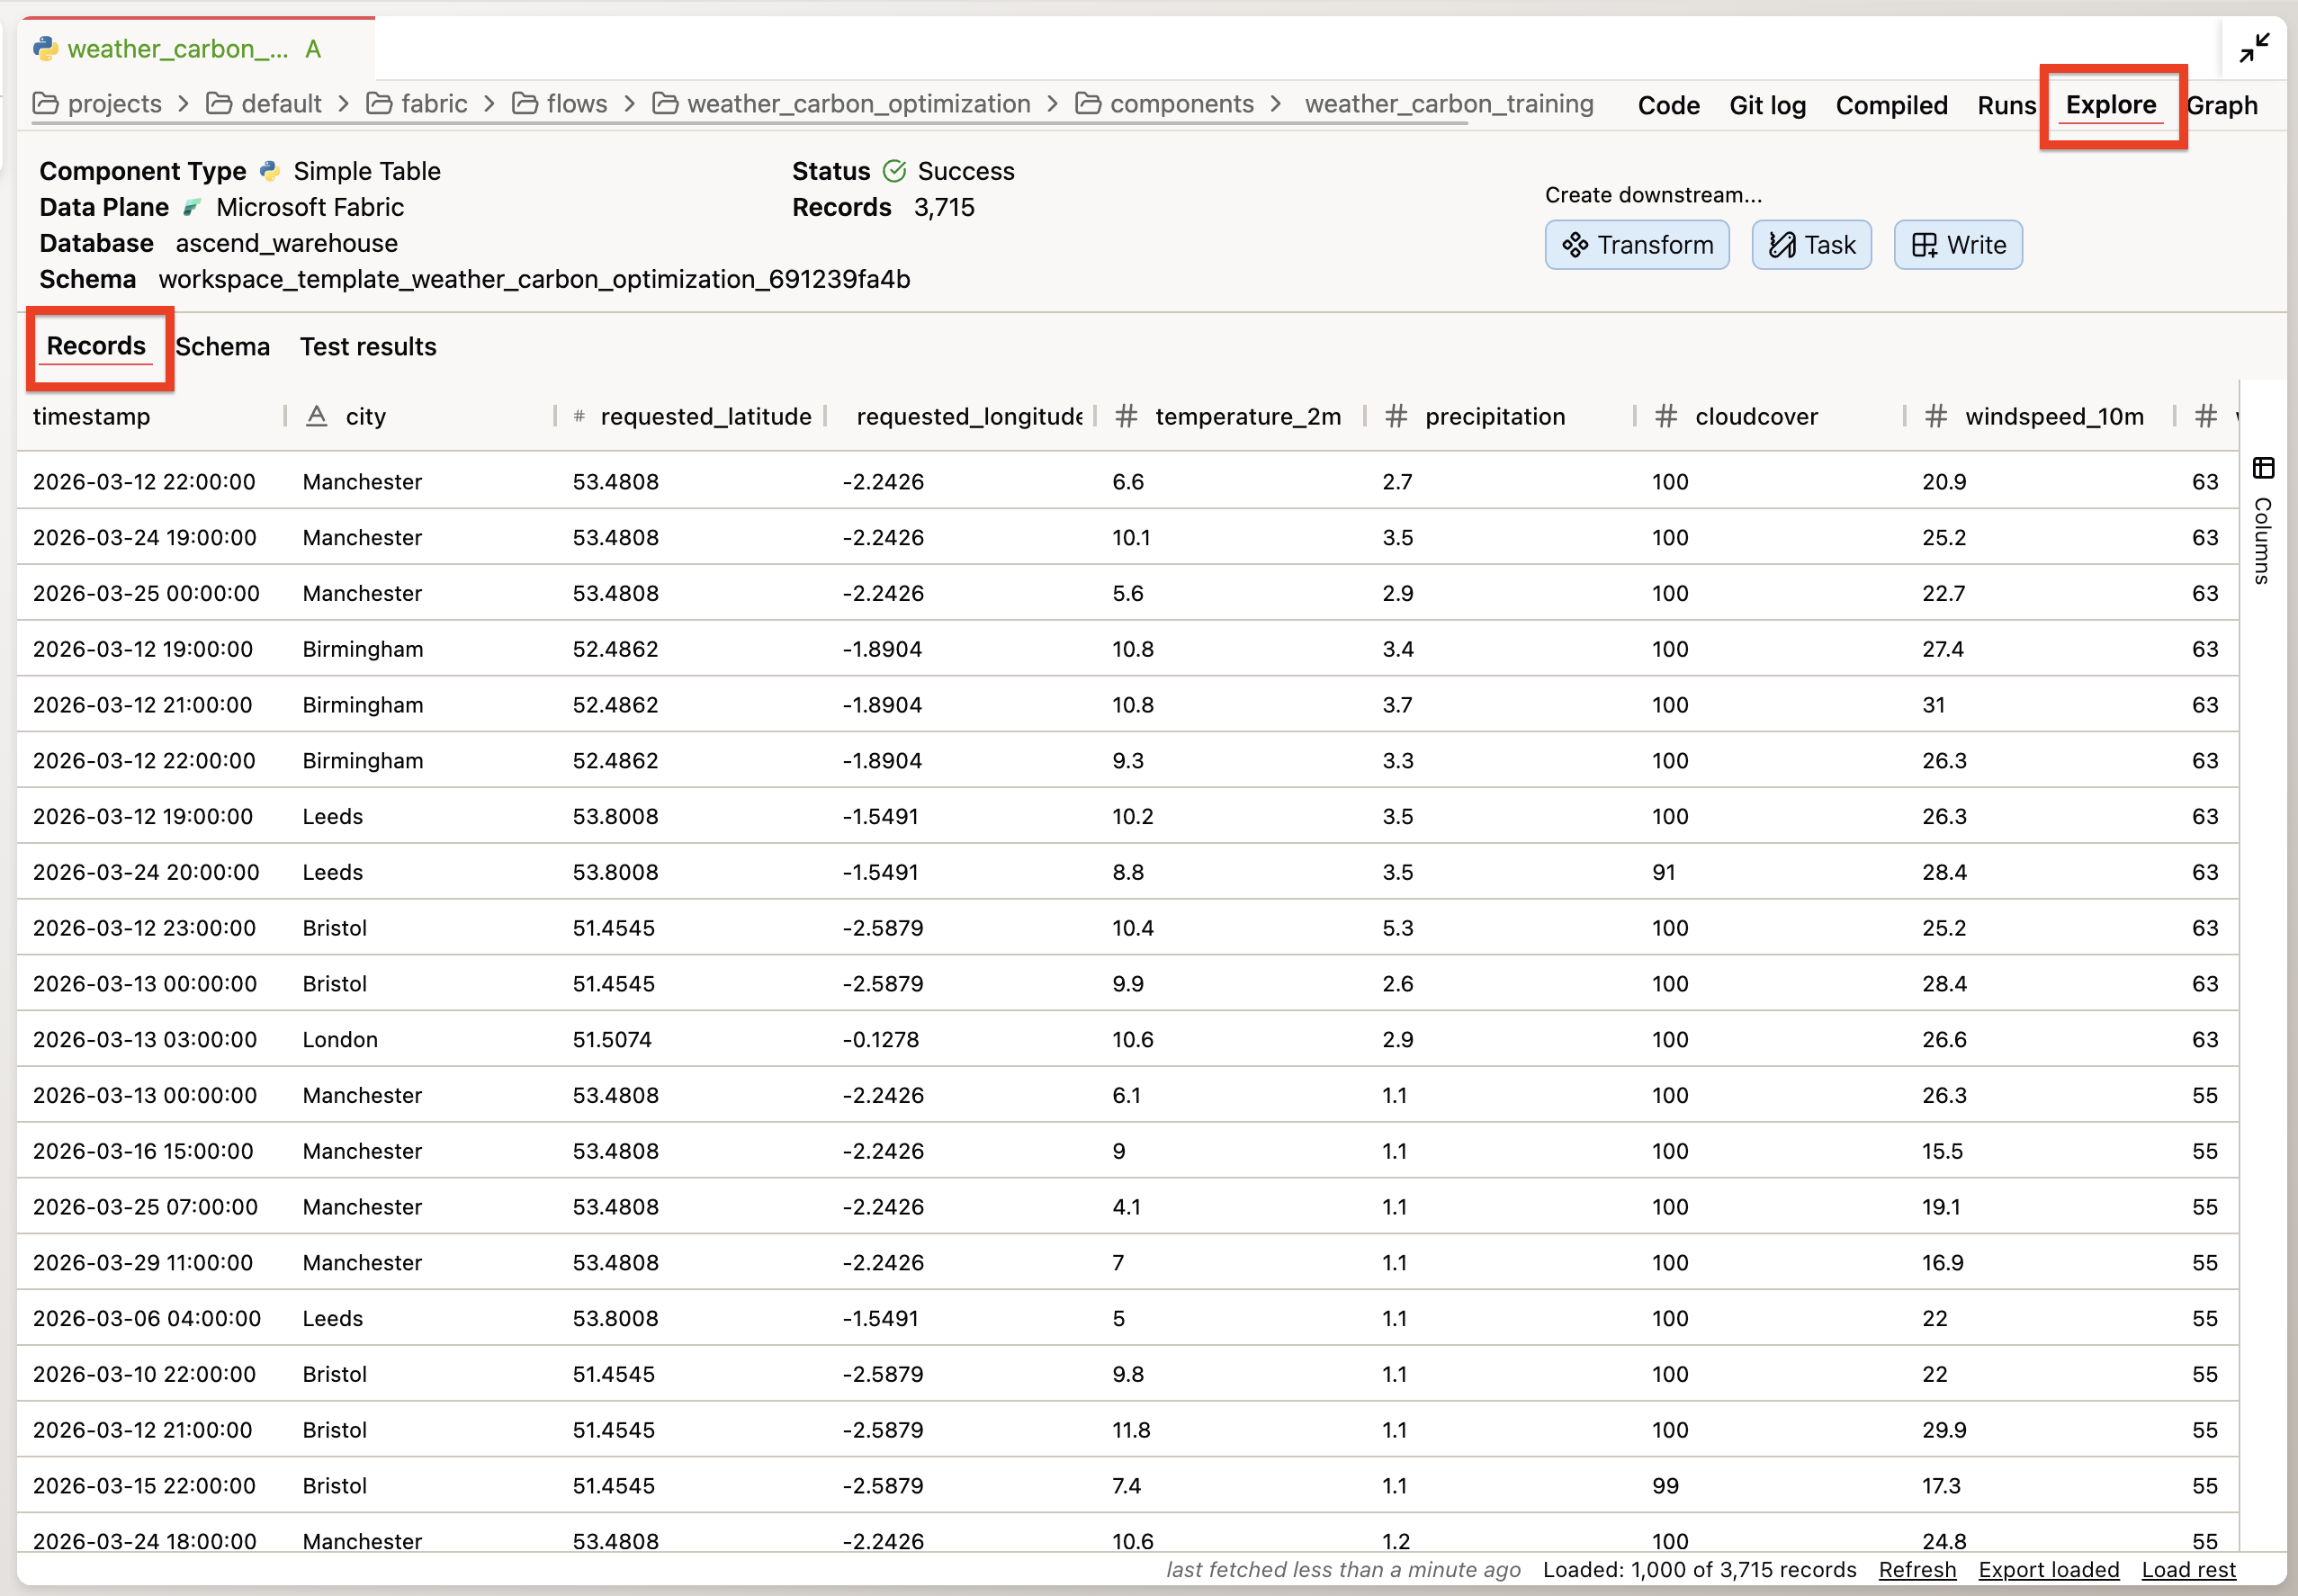
To inspect the data directly without prompting Otto, double-click a component and switch to the Explore tab — it lets you query the component's output data directly.
This is the data check. You're not looking for errors specifically — you're looking for anything unexpected: a channel that appears in some months but not others, a revenue total that's implausibly high or low, a row count that doesn't match the expected grain.
"No issues found" is a valid finding. The point is to have looked — and to have the record that you looked.
| Check | What it catches |
|---|---|
| 1 — Understand | Mismatched assumptions: what the flow is supposed to produce vs. what it actually produces |
| 2 — Inspect | Implementation drift: code that doesn't match the standards or business definitions |
| 3 — Query the data | Data surprises: unexpected patterns, missing channels, implausible numbers |
After all three checks, you have a verification record. Even if nothing was wrong, that record is your evidence that the flow was checked before it shipped.
Otto can run queries against your flow's output directly from the chat panel when auto-run is enabled. If auto-run is disabled, you can run the query manually: double-click any component in the flow graph, go to the Explore tab, and query the output data directly. Paste the results back to Otto if you want it to interpret them. The Explore tab on each component lets you inspect the underlying data without writing SQL manually. The three-check framework applies to any agentic system — the tool used to inspect the data changes, but the questions (understand the output, inspect the code, check the data) transfer everywhere.
Step 4: Set the trust level (~15 min)
You have verification evidence. Now use it to assign a trust level and write the criteria for moving up.
The trust gradient from the Governance module runs from L1 (suggest only — every action requires explicit approval) to L5 (full lifecycle autonomy — narrow scope only). Where this flow sits depends on what the verification evidence showed.
Based only on the evidence gathered in this session, where does this flow sit on
a trust gradient from L1 (suggest only — every action requires explicit approval)
to L5 (full lifecycle autonomy — narrow scope only)?

If the verification checks in the previous step were incomplete, cap the trust
level accordingly and explain why.

Write your assessment to plan/trust-level.md. Include:
1. Current trust level and the reasoning (what specific evidence supports it?)
2. Promotion criteria: what specific, measurable things need to be true to move
   one level higher?
3. A tool permissions audit: what tools do you currently have active in this
   session, and which are broader than this task requires?
What to check in plan/trust-level.md:
- Does the current trust level reference specific findings from Step 3 — not abstract claims?
- Are the promotion criteria measurable? "When it feels stable" is not a criterion. "Zero data quality flags across 30 consecutive scheduled runs" is.
- Does the permissions audit name specific tools? If the session has broader access than this task requires, note which permissions should be scoped down before promotion.
The governance principle: trust is earned incrementally through evidence, not assigned optimistically. The verification record from Step 3 is the evidence. The trust level documents what that evidence supports — and what it still doesn't.
Step 5: Create a Deployment (~15 min)
This is the step that makes the automations from ADE 101 real.
Automations — the schedule and the FlowRunFailure alert you created in ADE 101 — only run in Deployments. In a Workspace, they exist as YAML files but never fire. This is intentional: it prevents scheduled jobs from running accidentally in development environments.
| Workspace | Deployment | |
|---|---|---|
| Purpose | Development & testing | Production workloads |
| Git branch | Feature/dev branches | Main branch |
| Automations | Disabled | Enabled |
Create the Deployment
-
Open Settings — click your profile icon in the top right corner, then click Settings
-
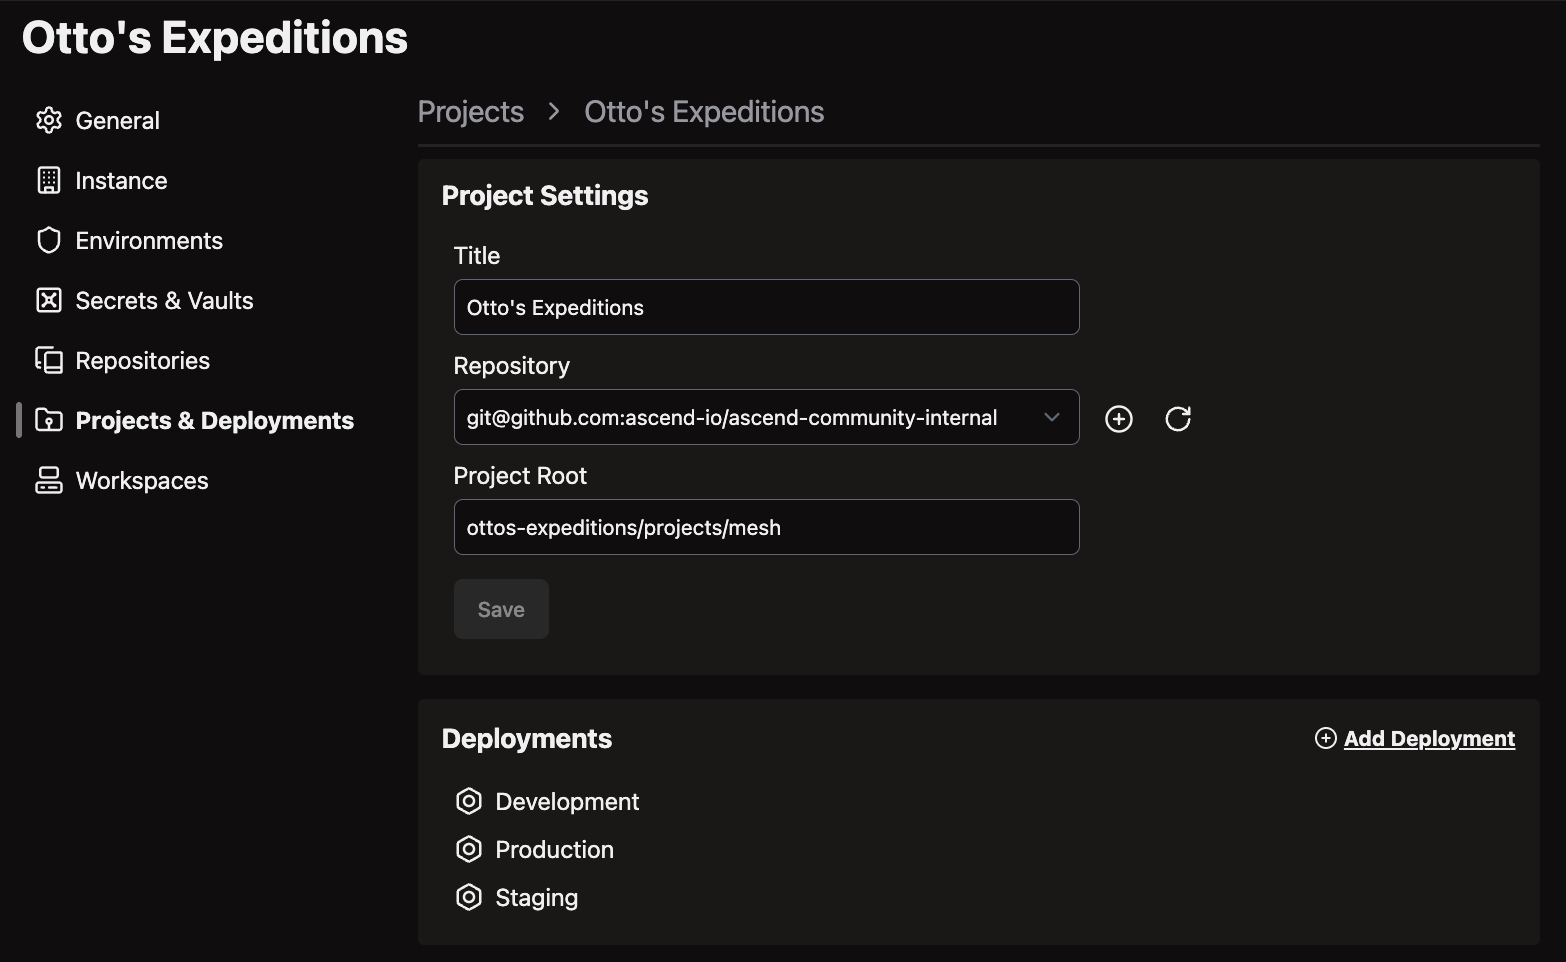
Click the Projects and Deployments tab → select the Default project
-
Click Add your first Deployment
-
Name it (e.g., "Production"), select branch
main, choose Profiledeployment_template, and set the compute size to XXS (Extra Extra Small)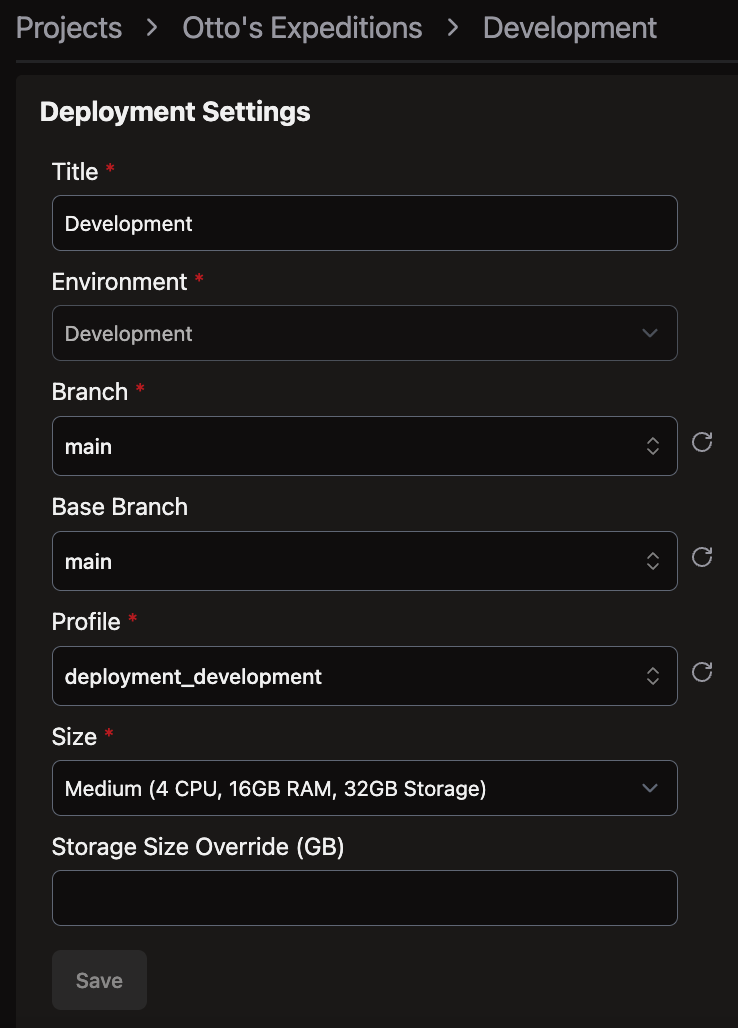
-
Click Save
XXS is the smallest available compute size and is sufficient for the revenue-by-channel flow at this scale. You can resize later if needed.
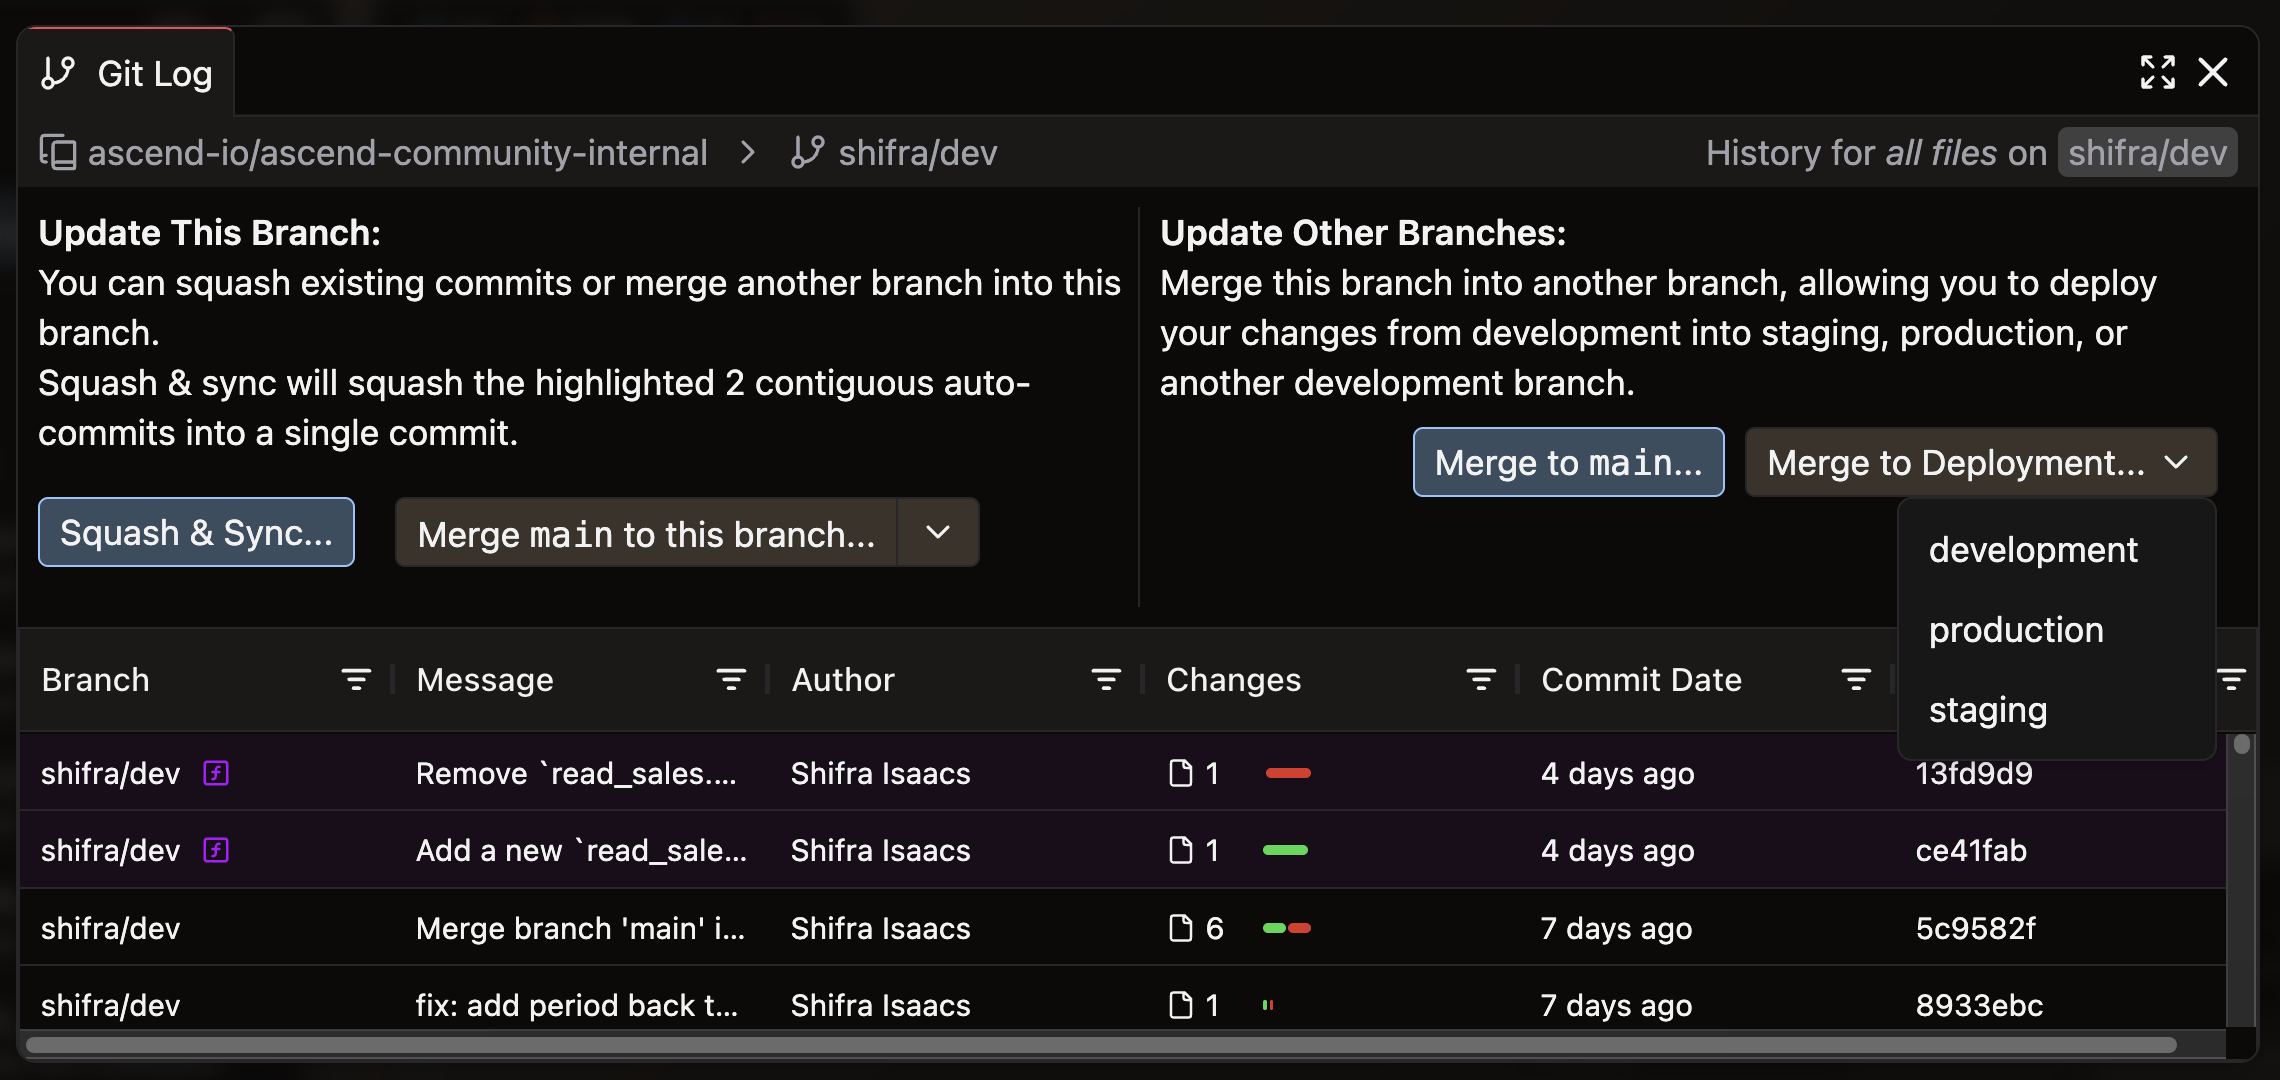
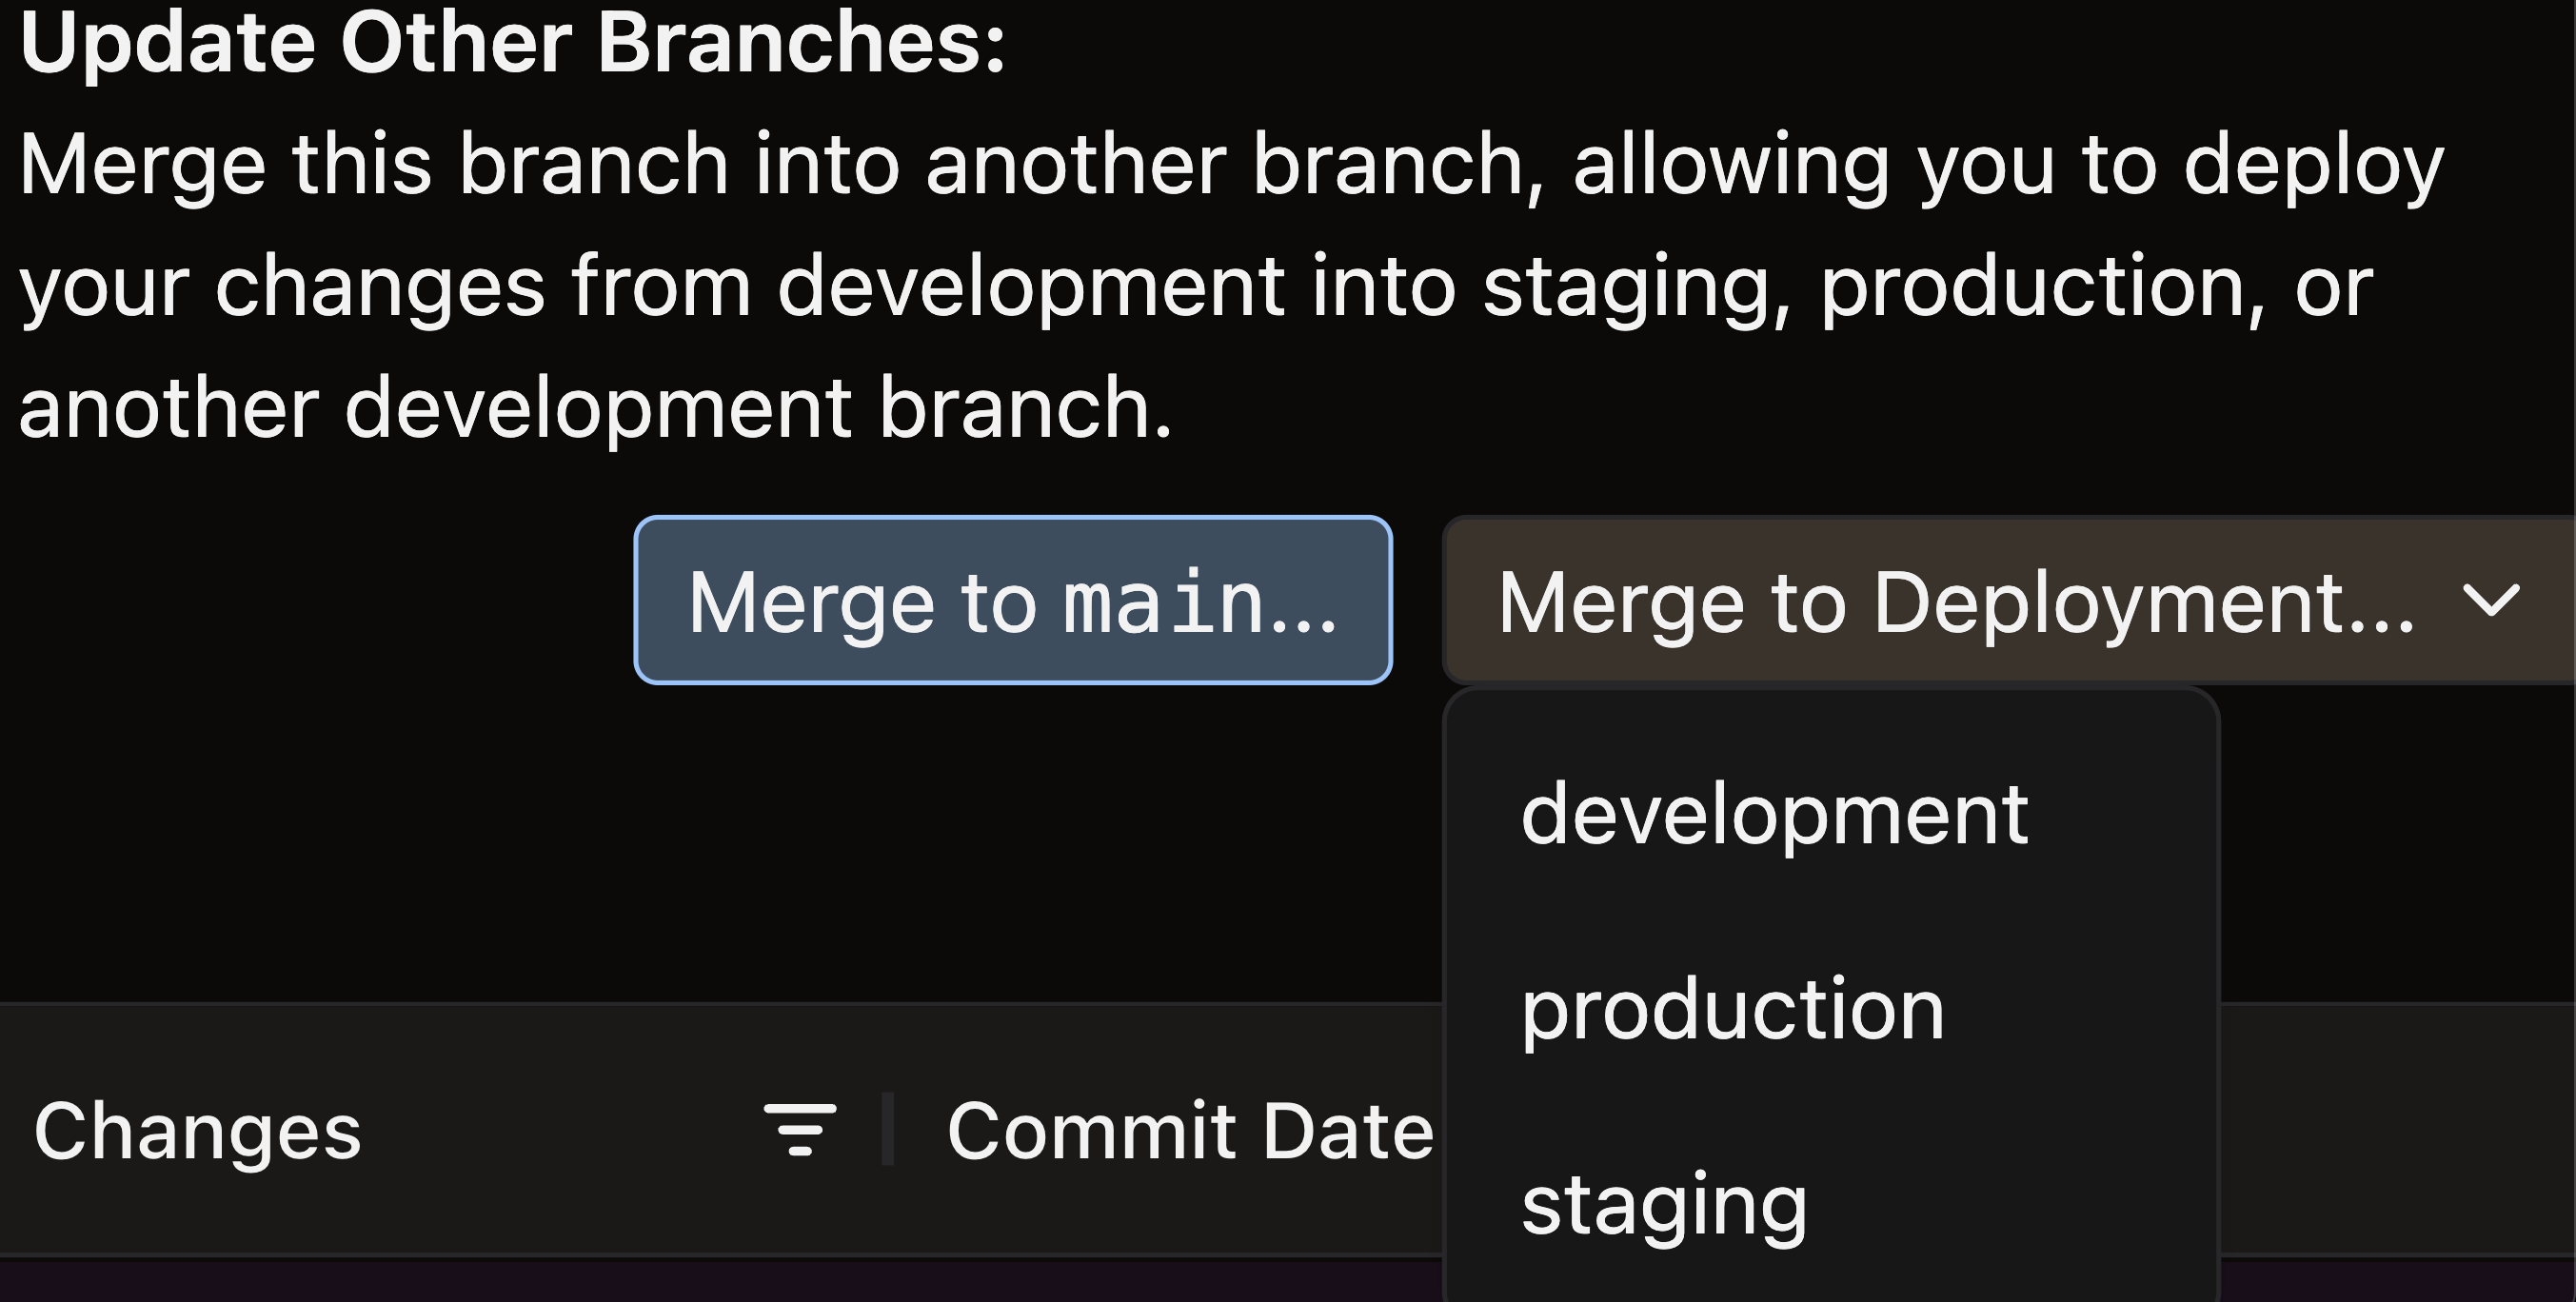
Merge to the Deployment
-
Return to your Workspace
-
Open the Source Control panel in the toolbar

-
Click Open Git Log & Actions to open the promotion modal
-
Review the staged changes — you should see the revenue-by-channel flow and the two automation YAMLs from ADE 101
-
Click Merge to Deployment → select your Production Deployment → click Merge
Confirm the Deployment
Navigate to the Production Deployment (Home screen, or Cmd+K / Ctrl+K and search "Production"). Confirm:
- The revenue-by-channel flow is present
- The daily 6 AM UTC schedule automation is listed
- The
FlowRunFailure → email_alertautomation is active
Then run the flow once manually — click Run Flow from inside the Production Deployment. This confirms the flow executes successfully in the production environment, not just in your Workspace.
Run the learning command (~5 min)
The context stack you have now is richer than the one you started with. The learning command captures what changed.
In a new Otto chat, run:
run @command/learning.md
Otto reviews the session and proposes additions to the rules files. Read each proposal. Accept what's accurate. Reject what's wrong or redundant. Add anything that's missing.
This is the learning loop from the Context Engineering module in practice. The context stack that ends this lab is better than the one that started it — and every future interaction with this pipeline benefits from that.
What just happened
You started this lab with a Workspace flow that couldn't fire its automations. You're ending it with a system that's documented, verified, governed, and live in production.
Check off what you built:
-
plan/architecture.md— single-agent decision with specific reasoning grounded in the Expeditions project -
otto/rules/sql_standards.md— glob-scoped rule for*.sqlfiles -
otto/rules/revenue_definitions.md— keyword-scoped rule for "revenue" -
otto/commands/learning.md— learning command -
otto/agents/failure-investigator.md— custom agent with investigator role, output format, and non-negotiables - Three-check verification completed — findings documented (or "no issues found" with a record of what was checked)
-
plan/trust-level.md— trust level assigned with evidence from Step 3, measurable promotion criteria, and permissions audit - Production Deployment created — revenue-by-channel flow present, schedule and failure automations active
- Flow run manually in Production — confirmed successful execution
- Learning command run — context stack updated
Before moving on, take two minutes with these:
- In Step 3, what did the three-check framework surface that build status wouldn't have caught? If nothing was wrong, what would you change about the checks to make them catch more?
- The Failure Investigator agent has a hard rule: escalate after 10 steps without resolution. Why 10? What happens if that limit is too low — or too high?
- The trust level you assigned in Step 4 — what's the single most important thing that would need to be true to move it one level higher?
- The four readiness dimensions are a gate, not a checklist. A "partial" on Guardrails means something specific needs to change before the system is safe to run autonomously — not that you can proceed with a note.
- Scoped rules keep the context window useful. An always-on rule is for guidance that applies everywhere. A glob or keyword rule is for deep expertise that only matters sometimes. The distinction becomes critical as the rules library grows.
- Verification before promotion, not after. The three-check framework finds things that look right but aren't. Running it before a flow ships to production means those findings are cheap to fix. Running it after means stakeholders have already seen the wrong numbers.
- Automations require a Deployment. This isn't a limitation — it's a safety mechanism. Development environments that fire scheduled jobs cause real problems. The Workspace/Deployment boundary enforces the separation.
ADE 201 ends where real production begins. You've built one system — architecture documented, context stack in place, output verified, governance assigned, automations live. ADE 301 covers what happens when you're running dozens of them: observability that catches reasoning drift before it becomes a data quality incident, orchestration across multiple agent types and teams, and the organizational patterns that separate deployments that scale from pilots that stall.
Next: ADE 301: Production Scale →
Additional Reading
- Introducing Agentic Data Engineering (Ascend, 2024) — The design principles for AI-native data systems that underpin the architecture and governance patterns in this lab.
- Research on interleaving reasoning and action in language models — Related background on interleaving reasoning and action in LLM agents; the verification-before-action practices in this lab are in the same spirit as the ReAct interleave approach.
- Building effective agents (Anthropic, 2024) — A practitioner-focused breakdown of agent architectures — workflows vs. autonomous agents, multi-agent patterns, and where complexity actually pays off. Directly relevant to the single-agent decision in Step 1.
- AI-Augmented CI/CD Pipelines: From Code Commit to Production with Autonomous Decisions (arXiv preprint, 2025) — Trust-tier framework for staged autonomy in CI/CD workflows; consistent with the approval gate and trust-level patterns used in this lab.
- 2025: The State of Generative AI in the Enterprise (Menlo Ventures) — Practitioner survey on enterprise GenAI adoption; themes around governance expectations and workflow-scoped deployments are consistent with the approach taken in this lab.
- Custom rules documentation — Reference for glob-scoped, keyword-scoped, and always-on rule configuration in Ascend.
- Custom agents documentation — Reference for writing custom agent system instructions and switching agents in Otto.
Connect with other practitioners building agentic data systems: Ascend Community Slack.